


 Arguments
Software
Resources
Comments
The Consensus Project
Translations
About
Support
Arguments
Software
Resources
Comments
The Consensus Project
Translations
About
Support
![]()
![]()
![]()
![]()
![]()
![]()
![]()
![]()
![]()
![]()


![]()


Latest Posts
- Skeptical Science New Research for Week #19 2024
- Climate Adam: How to visualise Climate Change (ft. Katharine Hayhoe)
- At a glance - Tree ring proxies and the divergence problem
- Why India is key to heading off climate catastrophe
- 2024 SkS Weekly Climate Change & Global Warming News Roundup #18
- Skeptical Science New Research for Week #18 2024
- At a glance - Clearing up misconceptions regarding 'hide the decline'
- Pinning down climate change's role in extreme weather
- 2024 SkS Weekly Climate Change & Global Warming News Roundup #17
- Fact Brief - Is Antarctica gaining land ice?
- Simon Clark: The climate lies you'll hear this year
- Skeptical Science New Research for Week #17 2024
- Water is at the heart of farmers’ struggle to survive in Benin
- At a glance - The difference between weather and climate
- India makes a big bet on electric buses
- 2024 SkS Weekly Climate Change & Global Warming News Roundup #16
- EGU2024 - An intense week of joining sessions virtually
- Skeptical Science New Research for Week #16 2024
- How extreme was the Earth's temperature in 2023
- At a glance - Is the science settled?
- What is Mexico doing about climate change?
- 2024 SkS Weekly Climate Change & Global Warming News Roundup #15
- Fact Brief - Did global warming stop in 1998?
- Skeptical Science New Research for Week #15 2024
- EGU2024 - Picking and chosing sessions to attend virtually
- At a glance - The Pacific Decadal Oscillation (PDO) is not causing global warming
- Climate Adam: Is Global Warming Speeding Up?
- 2024 SkS Weekly Climate Change & Global Warming News Roundup #14
- Gigafact and Skeptical Science collaborate to create fact briefs
- Skeptical Science New Research for Week #14 2024
Comment Search Results
Search for spencer clouds 2%
Comments matching the search spencer clouds 2%:
- The New Climate War by Michael E. Mann - our reviews
Nick Palmer at 09:33 AM on 23 June, 2021Just in case you lot are still resisting the idea that the politics relating to climate science have become extremely polarised - in my view to the point where ideologues of both the left and right think it justified to exaggerate/minimise the scientific truths/uncertainties to sway the democratically voting public one way or the other - here's a video blog by alt-right hero and part of the original Climategate team who publicised the emails, James Delingpole basically saying that 'the left' have infiltrated and corrupted the science for the purpose of using political deception to seize power for themselves.
https://www.youtube.com/watch?v=866yHuh1RYM
Deconstruct or follow up Delingpoles' rhetoric elsewhere and you will find a helluva lot of intelligent articulate people who believe that the public's environmental consciences are being exploited by closet socialist forces to deceive them, using 'fear porn', into voting for policies which they otherwise wouldn't consider voting for, in a dark strategy to bring in some form of latter day Marxism. They insinuate this has got its tentacles into climate science which they assert has led to the reality of the science, as presented to the public, being twisted by them for political ends. It's absolutely not just Greenpeace, as I already said, who've 'gone red' to the point where it has 'noble cause' corrupted their presentations of environmental matters and, crucially, the narrow choice of solutions they favour - those which would enable and bring on that 'great reset' of civilisation that they want to see. It's much, much bigger than that.
I think we are seeing a resurgence and a recrystallisation of those who got convinced by Utopianist politics of the left and free market thinkers of the right taught at University - Marxist-Leninism, Ayn Rand, Adam Smith etc. Most of those students eventually 'grew up' and mellowed in time, leaving only a small cadre of incorrigible extremists but who are now, as the situation is becoming increasingly polarised politically, revisiting their former ideologies. In essence 'woking' up. I submit that the real battle we are seeing played out in the arena of climate matters is not between science and denialism of science - those are only the proxies used to manipulate the public. The true battle is between the increasingly polarised and increasingly extreme and deceitful proponents of the various far left and right ideologies and their re-energised followers.
It is now almost an article of faith, so accepted has it become, amongst many top climate scientists and commentators, that 'denialism' is really NOT motivated by stupidity or a greedy desire to keep on making as much money as possible but is rather a strong resistance to the solutions that they fear are just 'chess moves' to bring about the great Red 'reset' they think the 'opposition' are secretly motivated by.
Here's an excellent article by famous climate scientist Katharine Hayhoe identifying those who are 'solutions averse' as being a major factor in denialism. It touches on the 'watermelon' aspect. You can turn a blind eye to what I am saying if you want, but in that case you should also attack Hayhoe too - but don't expect many to applaud you...
https://theecologist.org/2019/may/20/moving-past-climate-denial
Also try this: https://www.thecut.com/2014/11/solution-aversion-can-explain-climate-skeptics.html
https://today.duke.edu/2014/11/solutionaversion
I think some people who fight climate science denialism still have the naive idea that just enlessly quoting the science to them, and Skepticalscience's F.L.I.C.C logical fallacies, will make denialists fall apart. I too used to think that if one would just keep hammering away, eventually they would give up. Anyone who tries this will find that it actually does not work well at all. Take on some of the smarter ones and you will rapidly find that you are, at least in the eyes of the watching/reading/listening public, who are the only audience it's worthwhile spending any time trying to correct, outgunned scientifically and rhetorically. That's why I don't these days much use the actual nitty-gritty science as a club with which to demolish them because the smarter ones will always have a superficially plausible, to the audience at least, comeback which looks convincing TO THE AUDIENCE. Arguing the science accurately can often lose the argument, as many scientists found when they attempted to debate such notorious, yet rhetorically brilliant sceptic/deniers such as Lord Monckton.
I haven't finished trying to clarify things for you all but right back at the beginning, in post#18, I fairly covered what I was trying to suggest is a more realistic interpretation of the truth than the activist's simplistic 'Evil Exxon Knew' propaganda one. In short, most of you seem to believe, and are arguing as if, the science was rock solid back then and that it said any global warming would certainly lead to bad things. This is utterly wrong, and to argue as if it was true is just deceitful. As I have said, and many significant figures in the field will confirm, I've been fighting denialism for a very long time so when denialists present some paper or piece of text extracted from a longer document as 'proof' of something, I always try and read the original, usually finding out that they have twisted the meaning, cherry picked inappropriate sentences or failed to understand it and thereby jumped to fallacious conclusions - similarly I read the letters and extracts that Greenpeace used and, frankly, either they were trying deliberately to mislead or they didn't understand the language properly and jumped to their prejudiced conclusions and then made all the insinuations that we are familiar with and that nobody else seems be questioning much, if at all. The idea that Exxon always knew that anthropogenic climate change was real (which they, of course, did) AND that they always knew that the results of that would be really bad and so they conspired to cover that bad future up is false and is the basis of the wilful misreading and deceitful interpretation of the cherry picked phrases, excerpts and documents that has created a vastly worse than deserved public perception of how the fossil fuel corporations acted. Always remember that, at least ideally, people (and corporations) should be presumed innocent until proven beyond reasonable doubt to be guilty. Greenpeace/Oreskes polemics are not such proof. Their insinuations of the guilt of Big Oil is just a mirror image of how the Climategate hackers insinuated guilt into the words of the top climate scientists.
Here's a clip from my post#18
NAP: "When activists try to bad mouth Exxon et al they speak from a 'post facto' appreciation of the science, as if today's relatively strong climate science existed back when the documents highlighted in 'Exxon knew' were created. Let me explain what I think is another interpretation other than Greenpeace/Oreskes'/Supran's narratives suggesting 'Exxon knew' that climate change was going to be bad because their scientists told them so as far back as the 70s and 80s. Let me first present Stephen Schneider's famous quote from 1988 (the whole quote, not the edited one used by denialists).
S.S. "On the one hand, as scientists we are ethically bound to the scientific method, in effect promising to tell the truth, the whole truth, and nothing but – which means that we must include all doubts, the caveats, the ifs, ands and buts. On the other hand, we are not just scientists but human beings as well. And like most people we’d like to see the world a better place, which in this context translates into our working to reduce the risk of potentially disastrous climate change. To do that we need to get some broad based support, to capture the public’s imagination. That, of course, means getting loads of media coverage. So we have to offer up scary scenarios, make simplified, dramatic statements, and make little mention of any doubts we might have. This “double ethical bind” we frequently find ourselves in cannot be solved by any formula. Each of us has to decide what the right balance is between being effective and being honest. I hope that means being both.""
Stephen Schneider, as a climate scientist, was about 'as good as it gets' and he said that in 1988. Bear in mind that a lot of the initial framing to prejudice readers that 'Exxon knew' used was based on documents from considerably longer ago, so what are the activists who eagerly allowed themselves to be swept up in it until no-one questioned it turning a blind eye to? It's that the computer models of the time were extremely crude because computer technology back then was just not powerful enough to divide Earth up into enough finite element 'blocks' of small enough size to make model projections of much validity, in particular projections of how much, how fast and how bad or how good... Our ideas of the feedback effects of clouds and aerosols back then was extremely rudimentary and there were widely differing scientific opinions as to the magnitude or even the direction of the feedback. The scientific voices we see in Exxon Knew tend to be those who were suggesting there was lot more certainty of outcome than there actually was. That their version has been eventually shown to be mostly correct by a further 40 years of science in no way means they were right to espouse such certainty back then - just lucky. As I pointed out before, even as late as the very recent CMIP6 models, we are still refining this aspect - and still finding surprises. To insinuate that the science has always been as fairly rock solid as it today is just a wilful rewriting of history. Try reading Spencer Weart's comprehensive history of the development of climate science for a more objective view of the way things developed...
ExxonMobil spokesperson Allan Jeffers told Scientific American in 2015. “The thing that shocks me the most is that we’ve been saying this for years, that we have been involved in climate research. These guys (Inside Climate News) go down and pull some documents that we made available publicly in the archives and portray them as some kind of bombshell whistle-blower exposé because of the loaded language and the selective use of materials.”
Look at the phrases and excerpts that were used in both Greenpeace's 'Exxon Knew' and 'Inside Climate News's' exposés. You will find they actually are very cherry picked and relatively few in number considering the huge volumes of company documents that were analysed. Does that remind you of anything else? Because it should. The Climategate hackers trawled through mountains of emails - over ten years worth - to cherry pick apparently juicy phrases and ended up with just a few headline phrases, a sample of which follow. Now, like most of us now know, there are almost certainly innocent and valid explanations of each of these phrases, and independent investigations in due course vindicated the scientists. Reading them, and some of the other somewhat less apparently salacious extracts that got less publicity, and comparing them with the 'presented as a smoking gun' extracts from Greenpeace/Oreskes/Supran etc I have to say, on the face of it, the Climategate cherry picks look more evidential of serious misdeeds than the 'Exxon Knew' excerpts. Except we are confident that the Climategate hackers badly misrepresented the emails by insinuating shady motives where none were. Why should we not consider that those nominally on the side of the science did not do the same? Surely readers here are not so naive aas to believe that everyone on 'our side' is pure as the driven snow and all those on the 'other side' are evil black hats?
Here's a 'top eight'
1) Phil Jones "“I’ve just completed Mike’s [Mann] Nature trick of adding in the real temps to each series for the last 20 years (i.e. from 1981 onwards) and from 1961 for Keith’s [Briffa] to hide the decline.”
2) “Well, I have my own article on where the heck is global warming…. The fact is that we can’t account for the lack of warming at the moment and it is a travesty that we can’t.” [Kevin Trenberth, 2009]
3) “I know there is pressure to present a nice tidy story as regards ‘apparent unprecedented warming in a thousand years or more in the proxy data’ but in reality the situation is not quite so simple." Keth Briffa
4) Mike [Mann], can you delete any e-mails you may have had with Keith [Trenberth] re AR4? Keith will do likewise…. Can you also e-mail Gene and get him to do the same? I don’t have his e-mail address…. We will be getting Caspar to do likewise.” [Phil Jones, May 29, 2008]
5) “Also we have applied a completely artificial adjustment to the data after 1960, so they look closer to observed temperatures than the tree-ring data actually were….” [Tim Osborn, Climatic Research Unit, December 20, 2006]
6) “I can’t see either of these papers being in the next IPCC report. Kevin [Trenberth] and I will keep them out somehow, even if we have to redefine what the peer-review literature is!” [Phil Jones, July 8, 2004]
7) “You might want to check with the IPCC Bureau. I’ve been told that IPCC is above national FOI Acts. One way to cover yourself and all those working in AR5 [the upcoming IPCC Fifth Assessment Report] would be to delete all e-mails at the end of the process. Hard to do, as not everybody will remember it.” [Phil Jones, May 12, 2009]
8) “If you look at the attached plot you will see that the land also shows the 1940s warming blip (as I’m sure you know). So, if we could reduce the ocean blip by, say 0.15 deg C, then this would be significant for the global mean—but we’d still have to explain the land blip….” [Tom Wigley, University Corporation for Atmospheric Research, to Phil Jones, September 28, 2008]
Please at least consider the possibility that Greenpeace, who have been deceiving the public about the toxicity and carcinogenicity of this, that and the other for decades (ask me how if you want to see how blatant their deceit or delusion is... showing this is actually very quick and easy to do) were, in a very similar way, and motivated by their underlying ideology, deliberately (or delusionally) misrepresenting innocent phrases to blacken names excessively too.
- 2nd law of thermodynamics contradicts greenhouse theory
Tom Curtis at 22:27 PM on 19 February, 2017MA Rodger @1489, the energy balance diagram only shows energy movement between realms - ie, from the surface to the atmosphere, or from the atmosphere to the surface. It does not show energy transfer within the atmosphere itself. For that reason, the figure is not a good guide for estimated what Global Mean Surface Temperature (GMST) would be like in the absence of convection.
A better guide is Fig 4 from Manabe and Strickler (1964):
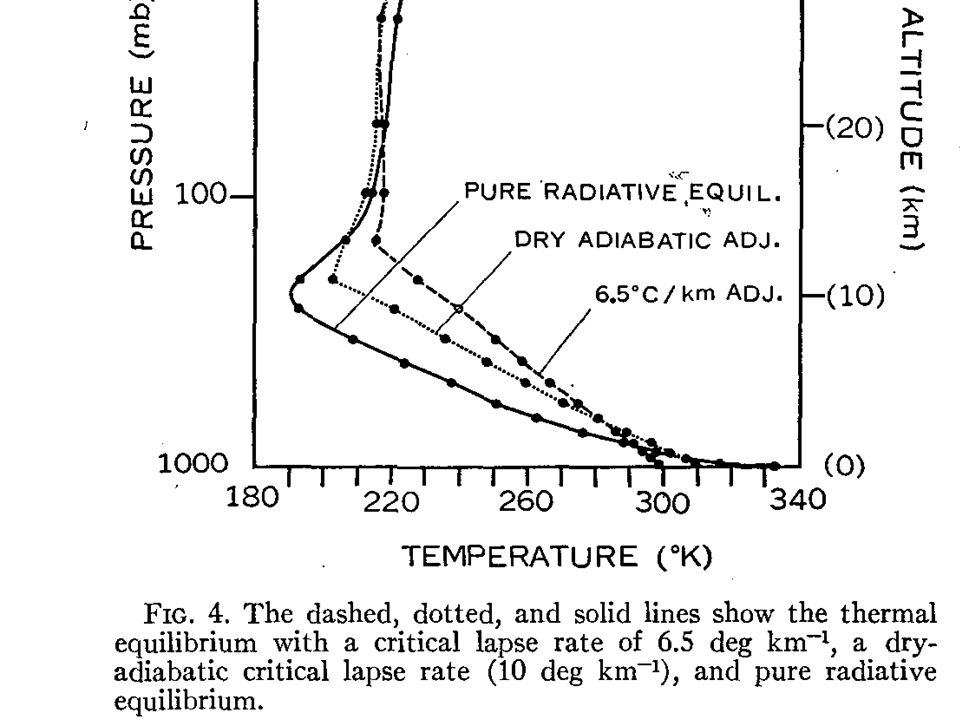
As you can see, from their model, an absence of latent heat transfer (ie, dry-adiabatic lapse rate) would lift GMST by about 10oC, while the complete absence of convection would lift it by about 45oC relative to current conditions. As the greenhouse effect on Earth raises GMST by over 33oC, the presence of convection cools the Earth by over 50% of the temperature increase that would occur from a greenhouse effect without convection.
Eliminating latent heat transfer within the atmosphere by the condensation of water would eliminate just under 25% of the greenhouse effect coupled with convection. That is an esoteric figure, however, given that 75% of the greenhouse effect is from water vapour and clouds. Consequently the combined effect (greenhouse and lapse rate) of water vapour in the atmosphere is to warm the Earth; although at a lower GMST it might be to cool it given the reduced greenhouse effect but near constant cloud albedo effect.
- Water vapor is the most powerful greenhouse gas
KR at 06:49 AM on 11 November, 2015old sage - Um, no. The only phrase in your comment that is correct is that "..as it warms, more water vapor is produced". Not even a complete sentence.
Water vapor acts as a feedback to CO2 driven temperature changes, and while it radiates a significant portion of climate energy to space, it's strictly through thermal emission from water vapor - not collecting energy from molecules 'dissolved in water droplets', which is complete, utter, nonsense. Nor by any means is it the only pathway to Earth emissions - CO2, CH4, CFCs, clouds, the atmospheric window, etc, all share in IR emissions.
The limiting factor in climate feedback is the Stephen-Boltzmann law, wherein energy radiated to space scales with total Earth emissivity and T4 temperatures.
I strongly suggest, 'old sage', that you do some reading before posting additional misunderstandings - The Discovery of Global Warming by Spencer Weart is an excellent and approachable place to start.
- Joseph E. Postma and the Greenhouse Effect
JPostma at 23:42 PM on 15 July, 2014Well, there is no other way that the radiative greenhouse effect is actually postulated. The 1-D models are its source. And as we've seen and had agreement on, the 1-D models do not correspond to physical reality in any way.
The Earth is not flat.
Solar input flux heating is not -18C.
If it were -18C it wouldn't be able to melt ice, create clouds.
The solution to that problem is not to postulate a radidative greenhouse effect, but to get the initial conditions right: the Earth is not flat and solar input is not -18C.
There is a minimum level of complexity required for a model to have any meaninglful correspondence with reality. The 1-D models do not satisy that. All they state is that energy in = energy out, and that's fine and obvious.
Therefore, the idea that radiation from the atmosphere heats the surface needs to be discarded, because that idea only comes out of the postulate required to save a bad model, a postulate which is itself therefore wrong. We see people agreeing that the 1-D models do not correspond to actual reality, but then they immediately turn around and try to justify the postulates from the 1-D model. This is not the way to go about things.
It doesn't matter if you add more layers or have higher dimeniosnality models. The postulate of the radiative greenhouse effect still has no basis. And we have been looking through the IPCC models, and there is no actual greenhouse effect in them, anywhere. Neither Spencer nor anyone else can identify it and say where in the models it is, or how it originates. What they will do however, is always refer back to the 1-D models! It's kinda crazy.
The 1-D model is not a simplified model. It is a wrong model which violates very, very basic, in fact fundamental features of the actual physics occuring at the surface. Such as sunshine melting ice and creating clouds. It is a wrong starting point, initial approximation - not a close one.
The fffective temperature is not an actual temperature measurement, but an inference given energy conservation and assuming unit emmisivity. For Earth, this is ~255K, corresponding to the expected ~240 W/m^2 average output from the globe. This temperature should not be expected to be found at the ground surface since for radiation, the surface is not the ground surface, and also, because of the natural lapse rate gradient of -g/Cp (can also factor for latent heat release which lessens the slope, as I showed in that paper) which mathemtically necessitates that the average will not be found at either extremity (ground surface or TOA), but somewhere in the middle, thus automatically making the surface warmer than the average.
A spectral plot is not evidence of a greenhouse effect. It is evidence of spectral absorption and scattering. You get spectral absorption and scattering when you have a cooler gas in front of a warmer source. The cooler gas does not cause or induce the temperature of the warmer source. As we have seen, solar input is actually much higher than -18C, latent heat release will hold the surface at a warmer temperature than otherwise, and the lapse rate gradient automatically necessitates a warmer bottom-of-atmosohere than middle and top. The 1-D model as designed by climate scientists is indeed, exactly and directly, about the attempt to use the spectral absorption of a cold gas as a way to make up for the erroneous "solar-heating deficit" produced by those very models. Yes the surface can warm the colder gas via absorption in that gas of "warm" surface radiation, but this does not translate back to a requirement that the surface must increase in temperature, because it is heating that gas. And such a scheme completely dismisses the existence of the lapse rate, of latent heat, and real-time physics where the sunshine actually does induce behaviour that the averaged solar input of -18C does not have the power to achieve.
And finally, let us be reminded that a real botanist's greenhouse should be able to function by that math and logic of the 1-D model and by the same of the spectral absorption argument: this should induce a higher temperature inside a greenhouse "glass box" than the maximum solar input is providing. The glass roof serves the role of the layers of the atmosphere and of miles of spectral absorption and scattering. But it doesn't happen - the maximum temperature is only equal to the solar input. Empirical measurement demonstrates that spectral absorption and/or layers of atmosphere absorbing radiation from the surface do not cause the surface to become warmer. When you factor in the fact that setting the solar input to -18C is not going to be able to reproduce any of the significant physics that actually occurs in real-time from actual high-power "hot" sunshine, then the rest of the thoughts and postulates which have ever extended from that likewise be extinguished. You should start over. The models aren't working anyway, the temperature isn't increasing like it was predicted. It is a good reason to reevaluate. Start over using actual heat flow physics in real time with the heat flow PDE, and show people all the work.
- Why Curry, McIntyre, and Co. are Still Wrong about IPCC Climate Model Accuracy
StealthAircraftSoftwareModeler at 14:20 PM on 17 October, 2013I’m trying to answer all the questions. I thought I had indirectly answered them but it appears not. So, here are explicit answers to questions in reverse order of posting.
Tom Curtis @177: Yes, I agree with your statement that short baselines are not fair in determining whether or not climate models fail or not. However, I do not think I was doing that. I only tried to reproduce the draft chart (left chart) with original source data, and I did that. You don’t think 1990 is a good start because that is only 23 years ago and we need at least 30 years. Okay, I can accept that. I’d reference Spencer’s chart here, but there is no need, other than to say “shame on him” for using a fake Time cover. You *can* expect more from me, I promise. But I do not like trend lines because if they are long then it takes a long time to detect a change. As an example, I could fit a line to the last 100 years of data, and even if temps plunged back down to -0.5C, it would take a long time for the trend line to change. Please give me the return courtesy of acknowledging that point.
Dikran @ 175: I read some links on SkS when I searched “climastrology” and none applied to my observation. I believe you mean Apophenia (http://en.wikipedia.org/wiki/Apophenia), which is seeing things in random data. I’m familiar with it -- children seeing animals in clouds is a classic example. Are you asserting that I am “seeing things” and that SOI oscillations are short term and there are no multi-decadal oscillations? Or that statistics has shown that what appears as a long term (100+ year) sine wave in the SOI really is not there? I’d like to see those results. Wyatt’s and Curry’s Stadium Wave paper (I’ve posted links or you can Google it) talks exactly to the issue that there *are* long oscillations in the AMO and PDO. How do climate models represent these major and oscillating climate drivers? My impression is that models assume ENSO, AMO, PDO average out to zero. Which could be an enormous source of error, and it wouldn’t show up in hindcasting, but it would show up when the large oscillation changes phase, like the last decade. In examining Tom’s SOI chart @159, it is clear that SOI peaked in 1983 and 1998, and since 1998 it has been plunging. And most of the SOI was pretty high from 1975 to early 2000, which is where all of the warming has occurred since 1950. Could be something, or it could be apophenia again.
Dikran @166: The specific questions you want answered:
“O.K., so if we are not going to use models that embody what we know of climate physics, specifically what should we use as the basis for policy decisions?” I believe we should use science, and models can be part of that. I build models and pilots literally risk their lives on them (humbling thought to me), but we test the crap out of them. I explain fully the uncertainties we know about and when and where things are not accurate.I am not confident at all that current climate models are accurate.
“Please specify how much testing and verification would be required for you to accept their use as a basis for policy making.” Wow, this is a hard question to answer. There is not a defined amount, but a range of testing. There is unit testing, and depending on the subsystem, it may get a lot more testing. Most tests are designed to confirm requirements are met, so those types of tests a well defined. The hard tests are to match modeling with measurements. This is where we go fly a test, measure a bunch of data, and then compare it to model predictions. Trying to figure out differences can be very hard. Is it the model, was it random noisy world effects, was the test instrumentation calibrated, and so on. Validation testing of a model is more of an evolving process based on the model than a check list. Validating climate models is hard because we cannot test against very accurate data sets for very long. Hindcasting isn’t accurate enough because the uncertainties of climate conditions are much larger than the CO2 signal.
“Lastly, please explain why you have not mentioned the occasions where models have under-predicted the effects of climate change.” I don’t think it matters -- wrong is wrong. Any model projection data in Tom’s chart prior to 1992 is a little suspect. I am certain that models did not correctly call the Mt Pinatubo eruption, so the projection dip in the early 1990’s has to have been a retro active adjustment to account for Mt Pinatubo. This is a completely reasonable thing to do, but has anything else been done to make the models look better in the past? That is the good thing about the recent model projections – they are well recorded in IPCC documentation and the Internet, so trying to move the goal post is very hard.
- Making Sense of Sensitivity … and Keeping It in Perspective
Nick Palmer at 22:06 PM on 30 March, 2013Rethinking my post (#39) and gpwayne's (#47), I think we now have a pretty unassailable case against the lukewarmers - the only part of the scepticosphere that still has a leg to stand on.
If +2°C is regarded as dodgy and +4°C is definitely dangerous, then even if Lindzen, Spencer and Christy's (even Monckton's!!!) admitted ~1°C figure is correct, the second doubling to 1120 ppm puts us in trouble. As I pointed out before, if the world thinks that sensitivity is as low as the minority suggest, it makes it far more likely that little or nothing will be done to mitigate, or even stop the growth of, emissions.
The only shred of Lindzen's ideas left to deal with is his contention that although the basic CO2 feedback is ~1°C, he claims there is a negative feedback from clouds based on his work with tropical clouds. Show that, even if that holds for the narrow band in the tropics, the probability is that it does not hold for the majority of the planet, particularly the polar regions, and the remaining scepticosphere case collapses entirely.
That may not be enough to fully convince the voting public who have been relentlessly propagandised by experts. The standard infuriatingly deceptive but dumb denialist memes, that the general public are pretty receptive too, should be handled by large full page press ads in high circuation newspapers with the memes (it's the sun, it's not warming etc) down one side and SKS type rebuttals down the other.
- The Big Picture (2010 version)
Bob Lacatena at 01:32 AM on 28 March, 2013tcflood,
As John H has said, you've been given a lot to pursue, but if you are a trained chemist, then you should have the capacity and the interest to do the following, and I would highly recommend it:
1) Completely restrain from making any judgment
2) At least peruse Spencer Weart's The Discovery of Global Warming to understand how deep climate science is (it is not young or immature).
2) Study the physics at the molecular level (vibrational modes of CO2, CH4, H2O, chemical and radiative interactions, etc.)
3) Study the physics at the atmospheric level (concentrations, chemical reactions, energy and content transport mechanisms, etc.)
4) Study the observational science, including: (a) paleoclimate methods such as O18, ice cores, ocean sediments, (b) how satellite and radiosonde measurements are done, and introduce error, (c) how ground observations are done
5) With that foundation in the physics and chemistry, study the impact of the oceans, including currents, heat transfer and chemistry (acidity), and physically constrained, large scale "oscillations" (like ENSO, PDO, etc.).
6) With that foundation in the complete climate system physics and chemistry, study the feedback mechanisms (methane release, ecosystem changes, ice/albedo changes, Hadley Cell expansion, H2O and clouds, etc.)
7) With that foundation in the physics and feedbacks, study the ice ages, what we know, and what we guess and why. Be sure to search for and look at actual scientific papers, not just summaries and encyclopdic articles.
8) With that foundation in the climate system physics, study the climate models themselves (there is a wealth of information available) in detail, to see how they incorporate the physics, how the allow for "unknowns", how they compensate for uncertainty, etc. to accurately model the earth climate over various time scales.
9) With that foundation in the full body of knowledge about climate science -- while recognizing that you have only touched the surface of these many branches, while there are thousands of expert scientists, like yourself, trained in far, far, far more detail in each of them -- go back and look at your own questions, and decide for yourself if they are (a) naive, (b) ill-phrased, and (c) easily answered, once you know what we actually know about the physics, and how each aspect of the physics and other knowledge builds upon the foundations.
- BEST Results Consistent with Human-Caused Global Warming
curiousd at 11:59 AM on 15 November, 2012
I will try this place to re - post comments I placed elsewhere. The moderator suggested a change of thread. I am interested in the optimum way to explain AGW to an audience with some scientific background but who are not in the climate field.
In the BEST graph, "Global Land Surface Temperature 12 - Month Moving Average" there is a logarithmic curve fit to the data, with downward spikes associated with named volcanic eruptions.
1. There is a deviation of the data that is a peak above the logarithmic fit, for the years around 1940. Does anyone have an opinion as to what this deviation is? Perhaps the Atlantic Multidecadel Oscillation, although it seems there is some question as to whether the AMO exists or not?
2. If I take many points on this curve fit that are away from the volcano spikes and plot the temperature increase since 1750 against the log to the base two of the CO2 concentration ratio, I get a nice straight line with a climate sensitivity of 3 degrees C. For explaining AGW to a scientist who is a non climate specialist, I think this is wonderful because it experimentally shows the 3 degree C.S. and therefore the fiddling around with cloud physics as done by Lindzen and Spenser is irrelevant. A general audience will not understand a detailed critique of - say - Spencer's tweaking. But they would understand that you get the 3 degrees C.S. without worrying about the clouds at all.
3. Because you get the 3.0 degrees C.S. experimentally, you do not depend on a simulation to argue the case. Again....the experts know the simulations are fine. But a non specialist, even with a scientific background, does NOT know this. The result directly from the BEST data gets around the "No one can trust a simulation ever" denialist argument, which is - to the scientifically trained but non climatologist individual usually the most difficult denialist argument to rebut.
I guess I am looking for comments because I have been invited to give an antidote presentation on AGW to people who have a technical background at a University where someone keeps inviting people like Monckton to present Heartland Institute misinformation. But what the heck....maybe the best thing to do is go ahead with it. - Roy Spencer finds negative feedback
curiousd at 17:41 PM on 14 November, 2012
Curiousd here. Interested in communicating these things to physics trained non climate scientists. To me, if I go to the Berkeley Earth website and use their "global land surface temperature plot 12 month moving average", I see a nice looking fit that ignores obvious volcano effects and is described as "logarithmic". If I take the temperatures from that graph, look up the CO2 concentrations of corresponding years, and plot delta T versus log to the base two of the CO2 concentration ratio I get an excellent straight line with a slope giving a climate sensitivity of 3 degrees C. So "clouds/shmouds"......Spencer is wrong and over the time span of the Berkeley Earth data the C.S. is 3 degrees centigrade. What is wrong with what I am doing? Or am I right? (I could show the result if I could figure out how to post a graph on this thread.) - Climate sensitivity is low
KR at 07:17 AM on 10 November, 2012
dana1981 - Actually, it's that those models with low sensitivity don't simulate humidity changes very well, not clouds. They note that clouds are a more difficult phenomena to observe, too.
Fasullo and Trenberth 2012 (described here) appears to be much in the same vein as Spencer and Braswell 2011, where they examined how climate models matched observations, although S&B 2011 was clearly refuted due to poor technique and the exclusion of models they themselves tested which refuted their conclusions. - Lindzen and Choi 2011 - Party Like It's 2009
alexharv074 at 00:40 AM on 6 July, 2012
KR, the paper is indeed quite short and Dessler clearly had written it with a view to refuting Spencer and Braswell 2011. He seems unaware that Lindzen and Choi's argument is not the same as Spencer and Braswell's. He asserts, for instance, that Lindzen and Choi's paper claims that "clouds cause climate change". In fact, their paper says nothing about clouds or the cause at all. It relates OLR to changes in SST. It is hard to take the paper seriously when it is not even clear that Dessler has even read the paper he briefly criticises. - Lindzen and Choi 2011 - Party Like It's 2009
KR at 23:43 PM on 5 July, 2012
alexharv074 - "...there is still no peer-reviewed response to LC11"
That would be incorrect - Dessler 2011 as referenced above is a direct rebuttal of LC11 and of Spencer and Braswell 2011, both of which argue (incorrectly, according to D11) that clouds are a forcing.
dana1981 - The Dessler 2011 link in the body of the article is broken. - Lindzen and Choi 2011 - Party Like It's 2009
KR at 23:38 PM on 5 July, 2012
It is worth noting that the LC11 article in Asia-Pacific Journal of Atmospheric Science is considerably longer than the LC10 PNAS submission that received the reviewer comments described above (I suspect 'skeptics' might object to this opening post on those grounds). However, to a large extent this is due to the page limits in the PNAS journal - the PNAS submission included a very large appendix that was brought into the APJAS article main body, and having read both I find the content significantly identical.
The final LC11 paper includes all of these issues: poorly described methodology, tropical rather than global data, no sensitivity testing for the time periods examined, no real addressing of the multiple papers that found much higher sensitivities from the same data, and the rather astounding conclusion that clouds are a forcing rather than a feedback.
That final item - clouds as a forcing - appears to be a common element in several attempts to prove climate sensitivities to be low. Dr. Spencer took much the same approach in his book The Great Global Warming Blunder and Spencer and Braswell 2008, where he believes most observed climate change is due to chaotic changes in cloud cover. From that, and an overly simple climate model, he obtained low sensitivity values.
This is just foolishness - Dessler 2011 (referenced above) and others have shown that the techniques used in LC11 derive the same low values and cloud forcing from models where the causality operates the other way around - a false conclusion. And contradicted by the responsiveness of humidity and thus clouds on temperature, as a feedback. It's a bad analysis.
I suspect, however (just my opinion here), that cloud forcing is attractive to skeptics because such analysis, while flawed, leads to low sensitivity values they find attractive - a confirmation bias temptation. - Global warming stopped in
1998,1995,2002,2007,2010, ????
matzdj at 12:34 PM on 17 May, 2012
Repost 1
Gee Whiz! I'm glad that I got so many comment on my post. I haven't had time to go through them all yet yet, but I promise I will. Here are some of my comments so far:
Sphaerica,
I didn't said that there is no "global warming'. What I'm trying to understand is how you build a causal relationship between a steadily increasing parameter like atmospheric CO2 concentration over this last 40 years and what appears to be a step change in average temperature level. I've read the first two articles you suggested but the key thing that I gained from them was a set of temperature rise data that was quite different than my starting point, which as you know came from Roy Spencer. I recognize that there are lots of questions about some of this proposals and theories and analyses, but is there any argument about the data reduction he shows from the NOAA GISS data? (I'm just talking about the data points and not the curve fits of the 13 month averages). The original post in this thread started with that curve, using it without question. Is there an argument that the blue dots on this curve are not valid?
http://home.comcast.net/~matzdj/SkepticalScienceNote051412/UAHRaw.jpg
If it's considered good data and a proper reduction of that data to average monthly global temperature, my argument still stands. Global temperature is higher now than it was in 1979. We all know that there is more C02 in the atmosphere now than in 1979. But, if you think about it, there are also many more microchips in use today than in 1979. Which causal relationship would you like to draw? [You mentioned inappropriate data presentation. I've read the book 'Cheating with Graphs". I try to look past the curve fit and don't see any axis stretching on this chart. ]
I am convinced that you you have to look at the data, not just statistically analyze it. Even something as simple as averages can be very deceiving. I went hunting last week. I fired at a duck and mssed by 6 in front. Then I took a second shot and missed by 6 inches behind. On the average, the duck is dead.
You comment that a 10 year analysis is too short for climate. I agree. But the lack of temperature increase over the period 2002-2012 when there was accelerating CO2 emissions certainly doesn't do anything to confirm the CO2 vs T relationship. Is there any expermental result that would convince you that the theory of CO2 relationship with global warming was incorrect? Has anyone identified an experiment that could possibly show that? Is there anyone running experiments that could say the theory is wrong? It seems to me that the anthropogenic believers don't waste their time looking. It's not science any longer. It's now a belief and almost a theology.
The post about Foster and Rahmstorf 2011 looks interesting, but I need to get the original article and try to understand it a lot better. From the "moving" curve posted by Dikran Marsupial. it appears their starting data was very similar to the UAH curve I started with, but they extracted out all the other effects. I hadn't seen this article and it looks interesting.
As a general comment, it is very interesting that when Temperature was rising, it was used as the evidence of global warming, but now that it looks like that trend has flattened, all of a sudden, we need to find a new way to prove that our original theory still holds. You're not supposed to start with the answer and then search for some data that matches the answer. As I said in my post, I was intrigued by the thought that heat content is probably a better way to look at global warming. However the NOAA chart I showed in my post seems to say that it's recent trend has also flattened .
You commented
a) Don't use short trends.
b) Don't assume that because the simple observations are noisy that you
can't extract a clearer signal from the data.
c) When you do look at the signal, and you also consider the complexity and
other factors in the system, everything makes sense.
d) Read and learn more before you adopt a position.
I try not to use short term trends, but I also try to not to ignore the short term trend that doesn't fit the model, unless I can find a cause that was not in the model. Then I try to fix the model to include that effect. Why is there no global temperature or global heat content response to increasing CO2 over the last 10 years. Who in the IPCC is trying to answer that question?
I can accept noisy data. What I can't accept is a 15 year set of data that is cyclical, but around a relatively stable mid-point demonstrating the low end and another similar set at a high mid-point being considered the high end and then having straight line being drawn between them. That is not good data interpretation. The correlation coefficient of a linear fit from 1979 to 2012 can't be very good - even if you ignore the El Nino and Mt Pinatubo anomalies.
I can accept that the complexity of the system makes it hard to interpret. I will seriously try to understand Foster and Rahmstorf , but I would much prefer to add all those exogenous effects into the model rather than trying to extract out the trend I was looking for to find an underlying trend. Data manipulation can lead the most sincere analyzer to put his biases into the manipulation.
Finally (to Sphaerica) I am trying to learn as much as I can before adopting a position. My present position is that I don't have one because when I look I can't find "settled science". i'm not saying that there is no relationship. I'm saying that I can't see it in the data that I can find.
To michael sweet,
I agree with you that an eyeball fit is certainly not as precise as a good statistical fit. I got lazy. I can't disagree with you that the data might have a slight upward drift. But all the statistics in this world would not show the data from 1979 thru 1996 having a trend that would lead to a midpoint that is 0.3°C higher by the 2002 until 2012 period. If I have the time, I'll try to extract the data and verify how good my eyeball is, but I can't believe that it will lead to a different conclusion. You can only get a different conclusion by including the latter data and trying to fit these two totally separate data sets with a single line. Has anyone tried checking to statistically see whether these two sets of data (1979-1996 and 2002-2012) are likely to be from two totally separate data sets?
To muoncounter and DSL
Just because you don't know the physical mechanism, doesn't mean there wasn't one. If Einstein had looked at his data that way, he would never have come up with Relativity. Keplar 's would have been happy with the "known' model and never come up with ellipses for the planetary orbits.
Since we know it's hotter and we know that CO2 is increasing and we know that CO2 is a global warming gas, we seem to have a definitive causal relationship. It seems to me that the AGW folks are using the the classical, " If the only tool you have is a hammer, everything looks like a nail."
I refused to go to the graduate school that had the Philosophy that no experimental result was confirmed until you have a theory. That's nonsense. If the experiment is unbiased and data reduction is done without bias, then you cannot honestly discard the conclusions it leads to just because you don't understand the physics of might have happened.
I agree that CO2 is a global warming gas, as are water vapor and methane and others. And clouds act as global coolers. The physics response of doubling CO2 calculated to about 1°C global temperature rise. It is only because of the projection models, with their assumed feedbacks, that leads to gloom and doom of 6° increases. How is the data we are discussing here consistent with that? Do any of these model predict what we have seen from 2002-2012?
To Dana
I need to spend a lot more time with the post that you described, but a quick glance seemed to once again be rationalizing how this result could occur, even if the answer that was posed was still correct. I can't buy continual rationalization.
There was also a comment that the poster didnt' t like a lot of the data sets used that discussed the potential of a step change in Temperature. Well....what is the data set that everyone is willing to accept? Is there one? I've been following the UAH data for the last 10 years. When I started, I didn't notice the flat period from 1979-1996 and only saw the higher levels in the post-1998 period. Since then, temperature has been higher, at an apparently fixed level (with cyclical variations around it). What I want to know is, " how is that consistent with steadily increasing levels of CO2 causing increases in global temperature?"
To Dikran Marsupial,
Your curve without the El Nino anomoly makes an interesting point. I blocked out that region when I did my visual analysis in an attempt to not bias my eye. By any chance has anyone done a Student-t analysis of the data from 1979-1996 versus the population from 2002-2012 to see whether they appear to be data from the same population?
Finally, Dikran, how did you have the two sets of curves flip up and back on your post. That's a great tool. Is this from the analysis of Foster and Rahmstorf ? I'm concerned about manipulating the heck out of data before trying to interpret it, but it is a worthwhile venture to try to find an underlying trend. I would be very interested in trying to understand what the causes of cooling were that masked the steady increase in temperature caused by CO2.
Thank you all for you inputs, I will stay on my search
Dave - Roy Spencer finds negative feedback
muoncounter at 12:15 PM on 25 April, 2012
Tom Curtis#64:
Well done, sir. Your clear presentation of these somewhat cryptic figures leaves us with little room to 'agree to disagree.'
The point about the lower figure d's progressive drift to the right in response to long term forcing is worth emphasizing. It is clear that if you follow the curve from left to right, there's been an overall warming of some 0.5 degrees. But that's just a model run, the 'skeptics' say. Per Uncle Ben#66, "in the real data, it appears to me that conditions are not nearly as noisy..."
Oddly enough, we can see what the real world looks like courtesy of this Sept 2009 blog post.
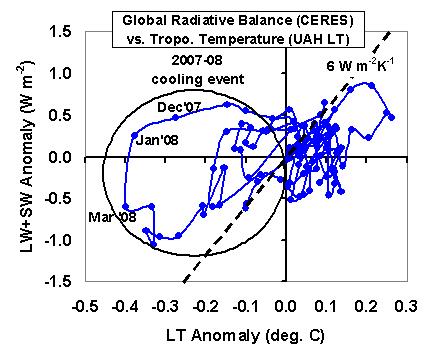
-- sourced immediately above
These data are Lower Troposphere (eliminating the TMT problem you identified above) and are averaged over a 3 month interval. The upper and lower trajectories in the circled 'cooling event' are on a much lower slope than the 6 (Watt/m^2)/degree line shown. Spencer describes this event as showing "a classic radiative forcing signature." Recalling that these slopes are inverse sensitivity, lower slope is higher sensitivity: Spencer's own analysis of the real data thus shows that sensitivity to radiative forcing is far greater than he has subsequently maintained.
Similarly, the entire packet of data points fall on a lower slope (on the order of 1.5 (Watt/m^2)/degree by eyeball). This figure resembles the lower figure d you showed, which has a comparable overall slope of 1.3. Further, the 3 month averaging reveals that the low sensitivity 'slope=6' is based on transient, short-term noise.
BTW, the magical slope=6 comes from Spencer 2007:
Our measured sensitivity of total (SW + LW) cloud radiative forcing to tropospheric temperature is -6.1 W m^-2 K^-1.
However, he concludes:
While the time scales addressed here are short and not necessarily indicative of climate time scales, it must be remembered that all moist convective adjustment occurs on short time scales.
That short-term (weather and seasonal) sensitivity is greater than long-term (climatic) sensitivity should be no surprise. Thus goes the Nobel Prize. - Roy Spencer finds negative feedback
KR at 01:22 AM on 24 April, 2012
Uncle Ben - You have now been pointed to multiple issues with Spencers work.
These criticisms include some peer-reviewed papers:
Dessler 2011 - "It is also shown that observations of the lagged response of top-of-atmosphere (TOA) energy fluxes to surface temperature variations are not evidence that clouds are causing climate change."
Trenberth et al 2011 - "...some efforts have been shown to contain major errors and are demonstrably incorrect. ...cloud variability is not a deterministic response to surface temperatures...many of the problems in LC09 have been perpetuated..."
They also include Taminos analysis, comments here, and the noteworthy problems in many of Spencers works with basic statistics.
If you continue to hold to Spencers work without considering or addressing these issues, I would have to suspect you are suffering from confirmation bias. - Roy Spencer finds negative feedback
Uncle Ben at 01:15 AM on 21 April, 2012
DSL: " The point is that you can indeed calculate sensitivity in a complex system; you just can't calculate it with the precision of a closed mathematical system."
I agree! In fact, Spencer has provided us a way to improve the estimate of sensitivity. By separating the trajectory of dH/dt vs dT into segments in which the effect of dH/dt and the non-radiative forcing that creates clouds in the absence of strong dH/dt, he has been able to estimate the slope of the regression of the latter.
He finds that the slope is about 6 in the usual units, as opposed to 2.5 using the combined data. This yields a sensitivity low enough to show that the feedback from dH/dt causes is negative. Doubling CO2 then is seen to cause only 0.5 deg. C of warming.
Not much calculation is needed, in fact. If you take the trouble to look at his plots, you will see that the straight-line segmenmts are numerous, parallel, and obvious. It is quite convincing. It is their slope which gives the sensitivity to dH/dt.
The plots are so clear in showing the straight-line segments that the precision is much higher than that of the widely scattered estimates of sensitivity found by other means. We know now why they are widely scattered. A variable has hitherto been ignored. - Roy Spencer finds negative feedback
skywatcher at 13:58 PM on 20 April, 2012
#1, to make a small addition to the moderator's comment, you have to ask yourself the following question:
If Spencer is right, why do a whole range of estimates of climate sensitivity from palaeoclimate observations contradict him?
Read Knutti and Hegerl 2008, and the SkS summary here. The thing about palaeoclimate and geological estimate of sensitivity is that they already include the total forcing by clouds and all other factors.
Essentially, whenever we estimate climate sensitivity, whether from geological events millions of years ago, from the last glacial maximum, the Holocene, the last century, or recent volcanic eruptions, the results tend to be in the range about 2 to 5C per doubling CO2. If Spencer was right, an awful lot of observational evidence from a lot of different, independent lines of enquiry, quite apart from model data, has to be wrong. Additionally they all have to be wrong in the same direction, by approximately the same amount. Likely? And you'd still have to postulate a mechanism by which we have had glacial and interglacial episodes generated from small Milankovitch forcings.
What is much, much more likely is that Spencer is as wrong on this as he has been on quite a number of climate-related matters. - Roy Spencer finds negative feedback
Uncle Ben at 11:50 AM on 20 April, 2012
I beg to differ.
Spencer has simplified his argument and presents it better in his book "The great global warming blunder." I will counter only three of Trenbert's arguments: 1) how Spencer deduces that sensitivity has been exaggerated, not from models, but directly from satellite data; 2) what is a feedback; and 3) what purpose his simple model serves.
1) Sensitivity may be calculated from measurements of radiative energy imbalance dH/dt and sea temperature anomaly dT, both averaged globally. A linear regression of the former vs the latter yields a slope that has been interpreted as the reciprocal of a sensitivity metric.
The basis for this method is the assumption that there is not any other significant forcing on the temperature anomaly than the radiative imbalance. The data are considered to be samples of a linear relationship between only two variables plus a large amount of noise.
If there were another significant forcing variable x unacknowledged in this process, there would be an error in this method. A change in dT caused by a change in dx would be mistakenly attributed to dH/dt, making dH/dt more powerful a factor than it really is. That is exaggerated sensitivity.
Spencer has demonstrated the existence of such a variable. He has connected the data points in the plot described above in the order of their measurement. This converts a set of points into a trajectory. The trajectory typically consists of a repeated alternation between two forms: a messy, loopy curve and a remarkably straight line. That alone strongly suggests two kinds of process which alternate in strength.
Spencer interprets this kind of trajectory as an alternation between the slow radiative process of warming the oceans upper layer and the rapid non-radiative process by which the upper layer creates clouds. Candidates for the non-radiative sources of the latter are ocean currents related to ENSO and PDO, which heat or cool the air and moisten or dry it. Clouds created by these sources vary over time in shielding power unpredictably, causing variation of their shading, which creates a radiative forcing. These clouds are not created by contemporaneous solar heating and cooling.
More than one forcing? That creates error. It is on the basis of this analysis that Spencer concludes that sensitivity has been exaggerated.
2) Trenbert denies that the second process described above is a forcing. Spencer follows the convention of engineers saying that there is one dependent variable, T, in this system. Feedback is a temperature change caused by a temperature change. Everything else that affects temperature is forcing. Clouds are forcing in this nomenclature. But that is irrelevant. Call it what you will, it exaggerates sensitivity.
3) Spencer's little model is not intended to model the atmosphere of the earth. It is a mini-model that shows that a system of a radiative forcing and a non-radiative forcing creates trajectories of the kind that can be seen in the satellite data, plotted with connections. It is a demonstration of the concept. It is especially useful in that it demonstrates how a simple system with given negative feedback can produce results that appear to involve positive feedback. - UAH Misrepresentation Anniversary, Part 2 - Of Cherries and Volcanoes
Arkadiusz Semczyszak at 01:28 AM on 29 December, 2011
A very "extensive post", really showing particulars errors UAH - Spencer and Christy.
... but, as usual, says "too much" of their - Spencer and Christy - general conclusions.
„Many papers indeed have claimed to find a human “fingerprint”, but upon close examination the evidence is simply consistent with human caused warming — while conveniently neglecting to point out that the evidence would also be consistent with naturally caused warming.” - write Spencer.
“... because “real world” amplification effects on short and long time scales are controlled by different physical mechanisms, and models fail to capture such behavior ...” - write Christy.
... It is these: “ ... a number of attempts to downplay the amount of warming.”
As a decisive evidence of the lack of impact - the climate - natural changes linked with the Earth and the Sun “... during the past 80 years ...”, presented in this year: Dickey and Marcus from NASA's along with de Viron, from the Universite Paris.
““Our research demonstrates that, for the past 160 years, decadal and longer-period changes in atmospheric temperature correspond to changes in Earth’s length of day if we remove the very significant effect of atmospheric warming attributed to the buildup of greenhouse gases due to mankind’s enterprise,” said Dickey. “Our study implies that human influences on climate during the past 80 years mask the natural balance that exists among Earth’s rotation, the core’s angular momentum and the temperature at Earth’s surface.”
This was to confirm this figure.
But when we "will correct" this figure - including figure (different data from ca 1980) that we get long-term cyclic anti-correlation (LOD- Glob. Temp.) - in "long time scales" - to this day.
About this is a R. Spencer blog - comments - Earth rotation - by salvatore del prete.
I recommend reading of Influence of solar variability on rotation and climate of the Earth, Kuznetsova (2010):
“We suggest a possible explanation of observed unexplained increasing in the Tnh [Temperature North Hemisphere] for the interval 1905-1940 and its subsequent decrease for 1940-1976 with rate 0.75 deg.C/100yr (in spite of the fact that the release of CO2 increased rapidly; at that time we had debates about the coming of a new ice age) by variation in w with period of 72 yr.”
“We present arguments of solar-lunar origin of the power cycle, which is approaching to a maximum for now.”
“The Poyting flux coming to polar cap leads in the end to heating of polar ionosphere and atmosphere, temperature contrast between two caps, intensification of the inter-hemisphere heat machine in the upper atmosphere ...”
And also affect the clouds cover and natural aerosols of atmosphere.
Next - for this reason: - heat comes now further (and bigger number of heat) in the North (the North Atlantic is narrow - like "neck of the bottle"). Arctic temperatures, Canada and Europe growing faster, also activated equatorial zone the deep upwelling - natural sources of GHG increase ...
... “fingerprint” this process “... be consistent with naturally caused warming ...”?
So, if we examine the (a comprehensive) other natural factors (not just the TSI, ENSO and volcanoes - supposedly the greatest - the most important natural factors), it ... - Is there a case against human caused global warming in the peer-reviewed literature? Part 2
KeefeandAmanda at 08:37 AM on 9 November, 2011
Yes, as you point out, the skeptic attempts to blame the Sun are falsified.
But the other main claim of the skeptics is also falsified, and this falsification does not seem to get a lot of press, and this falsification is this:
The skeptics deny what mainstream peer-reviewed climate science has to say on the greenhouse gas activity of non-condensing greenhouse gases like CO2 as forcers and water in the atmosphere as an amplifier (feedback). And so those that admit that the Sun's output has not changed enough to cause all or almost all the recent warming say that essentially only less reflected light has caused all or almost all of the recent warming. (Note that the claims of Svensmark and Spencer et al. with respect to cosmic rays or oceans or clouds ultimately reduce to the claim that essentially only less reflected light has caused all or almost all of the recent warming.)
There is a book that is partially available online as a Google e-book
"Solar activity and earth's climate"
by Rasmus E. Benestad, who obtained a Ph.D in physics from Atmospheric, Oceanic & Planetary Physics at Oxford University. (He is one of the many real climate scientists who contribute at RealClimate.) Go to page 176. We read, "Any mechanism involving the albedo implies strongest response in the daytime temperature. Observations, on the other hand, suggest a reduction in the diurnal temperature range where the night-time temperature has increased more than the daytime temperature (Houghton et al., 2001). According to Svensmark's hypothesis, the warming is due to the reduction in Earth's albedo (reflected light), and therefore a long-term reduction in the low-level planetary cloud cover appears to be inconsistent with the observations."
That is, what Benestad says above is simply a polite way of saying that the reduction in the global diurnal temperature range where the global night-time temperature has increased more than the global daytime temperature strongly falsifies the skeptic hypothesis that essentially only less reflected light has caused all or almost all of the recent warming. That is, if CO2+H2O greenhouse gas activity is as weak as the skeptics claim and the warming is entirely or almost entirely due to less reflected light, then there is nothing to keep enough heat from escaping out into space at night globally to avoid a global diurnal temperature range increase such that the global daytime temperature increases faster than the global nighttime temperature. But the opposite has been happening.
And note that this falsification of the skeptic claim that essentially only less reflected light has caused all or almost all of the recent warming is a strong falsification. That is, even though a constant global diurnal temperature range would suffice to falsify the skeptic claim, a decreasing global diurnal temperature range strongly falsifies it. And depending on its rate of decline and on whether this rate of decline is changing and how it is changing, one could argue that this falsification is not just strong but very strong or even very, very strong.
How do skeptics deal with the fact of the falsification of their denials of what mainstream peer-reviewed climate science has to say on greenhouse gas activity? They deal with it in two ways: They either ignore it or they try to use *local* phenomena to try to refute fact about *global* phenomena. That is, on the latter point, they try to use the fact that there has been an increase in the diurnal temperature range in some *local* climates to try to argue against the fact that the *global* diurnal temperature range has decreased. But since this is all about *global* climate and not about the climate of only cherry-picked parts of the planet, this attempt is just an embarrassment to those skeptics who try this.
By the way, if a skeptic tries to say that increased water in the atmosphere by itself with no or almost no forcing from non-condensing greenhouse gases like CO2 will save the day for the skeptic denial of what mainstream peer-reviewed climate science says about these non-condensing greenhouse gases, then consider this: The equations in physics providing the calculations that fit reality on this one are where? Answer: Nowhere. Everyone in the skeptic community who does not try to confront this problem in some meaningful way (like Svensmark) know full well that they cannot even begin to make the numbers work to their favor on this one, and so rather than embarrass themselves trying to make the numbers work to their favor they elect to just ignore this problem when confronted with it. - Clouds Over Peer Review
MarkB at 02:19 AM on 8 October, 2011
Respectfully, I do not understand how the claim in the article that 'They, too, insisted on clouds working as a strongly negative feedback on global warming.' is supported. I've read the paper, and I understand their point to be that feedback cannot be accurately 'diagnosed' from the observed data. This is quite different than saying that coulds work as a strongly negative feedback on global warming.
Now, if the article is not correct on this point, there is a problem with the rest of the argument made here about Spencer 2011 ignoring the prior literature as well. - Understanding climate denial
Dikran Marsupial at 00:07 AM on 29 September, 2011
cRR Kampen Most of those in denial of AGW fully accept that CO2 is a GHG, but assert that negative feedback means that the effects of the CO2 will be inconsequential (e.g. Spencer). Thus they are in no way in denial that CO2 is a GHG, nor do they dispute the direct effect of the radiative forcing from CO2, they just deny that this will cause temperatures to rise. The reason for this is that the fact that CO2 is a GHG and its direct effect on climate are now so strongly established as to be undeniable, even by those in denial (so they have to find ways in which the climate is self-stabilising to minimise the actual warming that occurs as a result of the enhanced greenhouse effect - e.g. clouds). - Lessons from Past Climate Predictions: IPCC AR4
NewYorkJ at 15:30 PM on 23 September, 2011
I'm reminded of this one just a few days ago, Dana.
Anthony Watts: "Oh dear, now we have three peer reviewed papers (Lindzen and Choi, Spencer and Braswell, and now Richard P. Allan) based on observations that show a net negative feedback for clouds, and a strong one at that. What will Trenberth and Dessler do next? Maybe the editor of Meteorological Applications can be persuaded to commit professional suicide and resign?"
Bart summarized the incident here.
What's remarkable is the above line by Watts remains in the post, shrillness and all, long after some, including the author of the paper he's botching, corrected him. Strange. - Trenberth, Fasullo, and Abraham Respond to Spencer and Braswell
Phil M at 20:31 PM on 20 September, 2011
Over on WUWT, I notice how they love to exagerate the scientific position so that it's always "catastrophic" & "CAGW".
"Spencer and Braswell plus Lindzen and Choi, it throws a huge monkey wrench in climate model machinery that predict catastrophic levels of positive feedback enhanced global warming due to increased CO2."
http://wattsupwiththat.com/2011/09/20/new-peer-reviewed-paper-clouds-have-large-negative-feedback-cooling-effect-on-earths-radiation-budget/
If you start at that point, anything less than catastrophic or apocalyptic means the conned can declare it was all overhyped.Classic strawman. - Dessler Demolishes Three Crucial 'Skeptic' Myths
Tom Curtis at 11:14 AM on 13 September, 2011
Camburn @45, that is an odd response by you. You are on record as saying, "Spencer is not the only one who shows that the 20 fold is .....a large large stretch to say the least." Note, the ellipsis is your original not very subtle attempt to imply some suitable ad hominen should be included, but it turns out on the most detailed analysis to date that 20 to 1 is a very good estimate, and that Spencer's 2.2 depends on assuming (at best) an unrealistically shallow mixed layer, and on the very dubious switch to three monthly (seasonal) data. Given that he claimed to be using 100 meter data, the apparent use of 25 meter data is very damning.
Unable to defend your original assessment of Dessler 2011 (and Spencer and Braswell 2011), you resort to distraction by drawing attention to Bart's blog comment analysis. Others have justly drawn attention to the discordance between your apparent extreme skepticism of peer reviewed papers and your credulity towards "blog comment science". I would rather address Bart's analysis directly, specifically, the claim that:
"“The approximate period of the ENSO cycle is around 5 years.”
I’m not talking about a cycle time, though. I am talking about the time it takes for clouds to react to temperature changes. That is, if you increase global temperature by 1 degC (and could hold it there), within 4.88 years, you will be 1-exp(-1) = 63% of the way to creating an opposing 9.5 to 10 W/m^2 reduction in insolation. The unit step response is plotted here."
For clarity of discussion, here is the step response plot referred to:
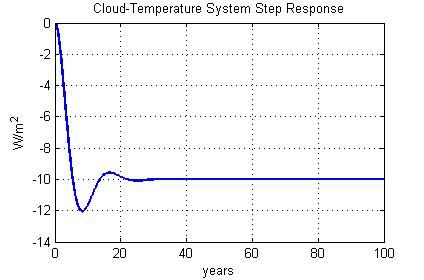
So let's put this into perspective. "Bart", an unknown commentator on a blog performs a statistical analysis which purports to show, without any physical mechanism, and on just 10 years data, that the climate response to a doubling of CO2 will be to reduce temperatures by approximately 1.5 degrees C. Oddly, you do not find this highly suspect, but rather "an excellent analysis".
Without going into technical detail like Nick Stokes, I find this claim simply incredible, ie, not possible to be believed. A negative feedback of such strength would either force the Earth into a Snowball state within 50 years if it only cools; or if it is a negative feedback on warming as well, would force the climate into wild multiple degree oscillations in mean global temperature on decadal timescales.
What is more, I cannot help noticing that his data (10 years) is to short to determine if the response he is detecting is cyclical or not. Given that, the apparently coincident timing with regard to the average return interval of ENSO events, and more compellingly to me, a half solar cycle, is highly suspect. To the extent that he is detecting anything, it seems far more likely that he is detecting a residual response to cyclical (Solar Cycle) or quasi-cyclical (ENSO) events. He provides no analysis rebutting that possibility. - Dessler Demolishes Three Crucial 'Skeptic' Myths
dana1981 at 01:23 AM on 10 September, 2011
Dale #37 - as far as I'm aware (though my info may be out of date), the only issue Dessler and Spencer are discussing is the ratio of ocean heat transport to TOA flux change due to clouds (Dessler's 20 to 1 ratio). Spencer claimed it was closer to 2 to 1, but commenters found a number of errors in his calculation. But I hope they can come to an agreement on a range of possible ratios based on the various available data sets.
Other than that, Dessler agreed to update his introduction to more accurately reflect Spencer's opinions regarding cloud changes not necessarily causing ENSO, but that won't effect the content of the paper. - Conspiracy Dog-whistling about GRL and the New Dessler Paper
ProfMandia at 20:19 PM on 9 September, 2011
Outstanding!!!
Any imperfections in the peer-review system certainly have not slowed the rapidly rising rates of carbon emissions and warming of the planetary system. Arguing about whose hose to use while watching a hourse burn is a prescription for disaster.
Of course, many are missing the real issue and that is Spencer wants us to believe in magic. We are well above the highest CO2 levels in the past 800,000 years and rapidly increasing that carbon. For some reason clouds are going to stop major climate changes this time even though they never did so in those previous 800,000 years. - Dessler Demolishes Three Crucial 'Skeptic' Myths
Albatross at 01:40 AM on 9 September, 2011
Camburn @18,
Please stop make unsubstantiated claims and talking through your hat. As per previous statements made by you on this thread you clearly do not understand the papers. And you have avoided answering the questions that i addressed to you here. I am glad though that you have acknowledged that "skeptics" are making comical and unsubstantiated claims.
I would advise you to read Chapter 8 of the latest IPCC report, it is a great overview, and explains the models developed by numerous research groups from around the world.
The point that you and people like Spencer continue to ignore is that several datasets also indicate a climate sensitivity near +3 C for doubling CO2. But Spencer, like Lindzen, is focussed on the models (that angle seems to be their last ditch end game), because, in his mind they are a cornerstone of the IPCC dogma. The man is paranoid and entertains conspiracy theories on a daily basis-- go to his blog if you don't believe me.
But back to Spencer's dear models. Funnily enough, the three models that compare best with with observations in his data and Dessler's (you know three models Spencer and Braswell ignored) have equilibrium climate sensitivities of +3.4 C (GFDL-CM2.1), +3.4 (ECHAM5/MPI-OM) and +3.2 C (MRI-CGCM2.3.2), respectively. But that is not really relevant to this discussion, but given that Spencer is so focussed on climate sensitivity it is odd that he failed to discuss this at all.
But it gets a little more interesting when one looks at the cloud feedbacks for the above models as shown in Dessler (2010), and that is relevant to this discussion:
GFDL-CM2.1: Short term cloud feedback +0.34 W m-2 (+/- 0.20), long-term feedback +0.81
ECHAM5/MPI-OM: Short term cloud feedback +0.74 W m-2 (+/- 0.20), long-term feedback +1.18
Results for the cloud feedback in MRI-CGCM2.3.2 were not reported in Dessler (2010), but the both the above models have both positive short-term and long-term cloud feedback.
With all that said, is Dessler (2011) the final word on this, probably not. But what is becoming increasingly clear is that a negative, nevermind strong negative feedback, from
clouds is highly unlikely, but Dessler is open minded enough to say that:
"A small negative feedback is possible, but one large enough to cancel the climate’s positive feedbacks is not supported by these observations."
Dessler also includes confidence intervals (something Spewncer and Braswell did not do). Now Dessler is in fact a good scientists who is really interested in the pursuit of truth, the very antithesis of Spencer. - Andrew Dessler's New Paper Debunks Both Roy Spencer And Richard Lindzen
Camburn at 22:46 PM on 7 September, 2011
Dave123:
You have hit it on the head. You can't make a case with present evidence for clouds doing much.
Neither Dessler nor Spencer have shown with any certainty anything. It is good that they are looking at this issue, but as of today, nothing conclusive is derived from either authors papers. - Andrew Dessler's New Paper Debunks Both Roy Spencer And Richard Lindzen
Albatross at 04:33 AM on 7 September, 2011
Eric @21,
" I'm going to have to refresh my memory on the conservation of energy issue"
Please do.
"Dessler in his paper makes no such claims either.."
Correct, but surely you understand the implications of Dessler's findings in the context of feedbacks and climate sensitivity, and claims that climate sensitive low b/c of a negative feedback from clouds arising from some mystical force. Also, Dessler (2011) exposes the lengths that Spencer and Braswell went to try and mislead people concerning the veracity of the the models discussed in the IPCC reports. Perhaps that action is a reason to have SB11 retracted. - Andrew Dessler's New Paper Debunks Both Roy Spencer And Richard Lindzen
Albatross at 01:47 AM on 7 September, 2011
Eric @11,
S&B postulated that clouds caused some of the ENSO temperature changes, not ENSO itself
Actually, that is not clear Eric, b/c what Spencer is trying to argue is not clear. If you follow his online discussion (sorry, I cannot recall exactly where that was held off the top of my head, but I did find this), Roy's reasoning was almost incoherent and at times his statements are inconsistent. We know that clouds, especially deep convection, respond to the change sin surface winds and SSTs associated with ENSO, and those changes in cloud cover probably have some feedback.
And no comment from you Eric about the problems with Spencer and Lindzen's and Braswell's and Choi's thinking running into trouble with the conservation of energy.
"Their real conclusion is that it is not simple to extract cloud feedback (or even the sign) from temperature changes the way that the models are claimed to do. "
That may be, but that is most definitely not even close to how their findings have been spun and distorted, not only by the denial misinformation machine, but by Roy Spencer himself.
I have said this elsewhere on SkS, and it still applies today (especially after Spencer has now made a rather brazen defamation attempt on Dessler noted by Sphaerica @9):
"Spencer is now clearly using science as a political tool in his ideological and political vendetta against the IPCC and climate scientists who are rightly concerned about the impacts of us doubling (or even quadrupling CO2). I find that incredibly disturbing."
Spencer's actions of late also make his claims about being interested in advancing the science ring hollow.
Eric you noted on another thread that:
"With such gross oversimplifications on both sides I can't help but think Spencer is arguing about nothing."
Yes, on that we agree. - Andrew Dessler's New Paper Debunks Both Roy Spencer And Richard Lindzen
Bern at 00:30 AM on 7 September, 2011
Eric(skeptic) @ 8: that may be the question you would like answered, but it's definitely not the question that S&B11 was trying to answer, which was more like: are clouds causing ENSO (and any and all climate change)?
Dessler seems to answer that question strongly in the negative. - The human fingerprint in the daily cycle
muoncounter at 23:40 PM on 4 September, 2011
Norman#124: "I could agree to the first one (but the degree of influence is not so certain).
The first being 'human influence on climate.' Norman, you've given a stock response phrase, more appropriate to the pages in the realm of the uncertainty monster. You brought up the contrail example; 3 days of only a change in the number of airplane flights produced a measurable change in a key climate variable -- the degree of influence is there for you to see.
"Not sure about the GCR debate, looked into it some but not heavily."
The point here is not the mechanism that stimulates high clouds; it is the existence of those clouds. Contrail-caused clouds had an effect; GCR clouds (if such actually exist, which I strongly doubt) would have the same effect. Svensmark's mythic effect is overturned on this basis alone.
"Last one, the measurable effect of contrails is localized but it can imply clouds (Spencer) do play a significant role in Earth's energy balance."
Yep, these data show that clouds can trap OLR, which is clearly a positive feedback. That is indeed significant. But Spencer's magic clouds are supposed to be a negative feedback, while Dessler finds positive feedback. What data did Spencer produce for the magic cloud argument?
Norman, the picture keeps coalescing. It is time to abandon those who preach 'we don't know' and 'its not certain' as dead-enders. Take a sheet of paper and make two columns. In one, list the observations one has to reject in order to objectively say 'we don't know.' In the other, list the convoluted explanations needed to explain away those observations - and the supposed observations that support them. When you're done, you should have an approximate outline of the contents of this site. Rather than pick away at the evidence one bit at a time, look at the weight of the evidence. Can you really say with any objectivity 'we don't know'? - The human fingerprint in the daily cycle
Norman at 15:45 PM on 4 September, 2011
muoncounter @ 116
"But you must admit some, if not all of the implications:
- Human influence on climate is a proven fact.
- High cloud cover can trap heat (contrails and the hypothetical GCR-nucleated clouds, if any exist, are both high cloud forms).
- If sensitivity was small, why would there be any measurable effect of contrails? They are a small subset of the overall cloud cover."
I could agree to the first one (but the degree of influence is not so certain). Not sure about the GCR debate, looked into it some but not heavily. Last one, the measurable effect of contrails is localized but it can imply clouds (Spencer) do play a significant role in Earth's energy balance.
Here is a quote from an article:
"Ongoing debate
In a study published in 2004, for example, Minnis and colleagues reported that contrails are capable of increasing average surface temperatures sufficiently to account for a warming trend in the U.S. between 1975 and 1994. But some climatologists believe Minnis and his colleagues may have overestimated the contrail warming effect.
Even if Minnis's estimates are correct, other climate experts feel that any warming from contrails is not something to fret about. In a study published in 2005, James Hansen of NASA's Goddard Institute for Space Studies in New York, and colleagues ran models that increased the contrail coverage in Minnis's study by a factor of five. Even with this significant increase, Hansen's team found that global mean temperature change was in the neighborhood of 0.03°C (0.05°F)—a minute amount."
Hansen believes it has very minimal effect on the global mean temperature. A cloudy day can cause significant temp difference in a local area but not effect the global temp much.
Source article for above quote. - The human fingerprint in the daily cycle
Norman at 12:27 PM on 4 September, 2011
muoncounter @107
I like your clever intellect and how you were able to determine so much from my post. Your post reminds me of the Missouri River flood of 2011. My thoughts were contained in the banks of DTR but yours seem to have topped the banks and entered a lot of other area.
I would like to question your point. "To rephrase, increased clouds in the east resulted in less OLR, ie, more heat retained. That nicely rebuts such silliness as Spencer's magic clouds and the general desire to hang a negative feedback on clouds (largely because its cooler on cloudy days)."
There is another possibility you should consider. It may be that more heat is retained but another strong possibility exists to explain the OLR. The cloud cover has cooled the surface of the Earth so there is less available IR being radiated.
Stefan-Boltzmann calculator.
To simplify I used a one for emissivity in both calculations. Here is one for you to consider. The area not covered with clouds could reach a warmer daytime temp. I used 80 F in the calculator (after converting to Kelvin) for the cloudless area. The earth would emit 457 watts/meter at this temp and an emissivity of one. For the cloudy sky I used 70 F. In this case the earth would emit 424 watts/meter. I am not saying this was the actual case for your point. I am only using this example to point out that the earth's surface temp has a considerable effect on the OLR measured. - Journal editor resigns over 'fundamentally flawed' paper by Roy Spencer
Albatross at 08:39 AM on 4 September, 2011
Eric @19,
Re my comment that "S&B state that one cannot (with the current observations and observation system) disentangle the two (i.e., conduct a feedback diagnosis), but then go on to repeatedly and very confidently claim that ...."
You are, of course correct, what I mean to say is that ".....Spencer repeatedly and confidently claims that clouds are a negative feedback".
One does not have to look very far to find confirmation of this. From his latest blog post:
"As I have challenged Dessler to do, if he really believes that is happening, then he should do LAGGED regression to estimate feedback…that is, adjust for the time lag in his regression analysis. And when he does that, his weak positive cloud feedback diagnosis will suddenly turn into a negative feedback diagnosis. I’ve done it, and it is what Lindzen and Choi did in their recently published paper, which resulted in a diagnosis of strongly negative feedback."
That is but one of several examples of Spencer arguing that the cloud feedback is low, and he is at least consistent in that sense, since one cannot argue for a climate sensitivity for doubling 1.5 C without the cloud feedback being zero or negative. And it is very troubling that he is citing Lindzen and Choi at truth, when it has been thoroughly debunked, and that paper does deal only with the tropics.
The reality remains that multiple, independent studies have found evidence for a positive cloud feedback, as discussed here at SkS. Another example of a weak positive cloud feedback is the warming over the Arctic (and a strong positive WV feedback) leading to increased cloud cover which at those high latitudes leads to further warming (see Screen and Simmonds, 2010):
"Changes in cloud cover, in contrast, have not contributed strongly to recent warming. Increases in atmospheric water vapour content, partly in response to reduced sea ice cover, may have enhanced warming in the lower part of the atmosphere during summer and early autumn."
Spencer is now clearly using science as a political tool in his ideological and political vendetta against the IPCC and climate scientists who are rightly concerned about the impacts of us doubling (or even quadrupling CO2). I find that incredibly disturbing. - Journal editor resigns over 'fundamentally flawed' paper by Roy Spencer
Eric (skeptic) at 04:23 AM on 4 September, 2011
Albatross, you say that S&B "then go on to repeatedly and very confidently claim that clouds are a forcing mechanism (without providing a sound physical mechanism), that the cloud feedback is negative and that as a result that climate sensitivity is low".
True about the forcing claim (and mot describing a mechanism) but I don't think they claim cloud feedback to be negative. S&B state: "We hypothesize that changes in the coupled ocean-atmosphere circulation during the El Niño and La Niña phases of ENSO cause differing changes in cloud cover, which then modulate the radiative balance of the climate system. As seen in Fig. 3b for the ocean-only data, the signature of radiative forcing is stronger over the oceans than in the global average, suggesting a primarily oceanic origin."
Sounds like strictly ENSO-driven forcing, not feedback. It's hard to directly answer your question about correctness. Spencer's main empirical claim (explained here http://www.drroyspencer.com/2011/02/radiative-changes-over-the-global-oceans-during-warm-and-cool-events/) is that he measures a higher rate of energy gain (or loss) of energy in the time leading up to a temp max (or min) than the models. Following the temp max (or min) he measures a higher rate of energy loss (or gain) than the models. That is "correct" but it is not very meaningful It is telling that about 19 months after the temperature max (or min) the loss (or gain) goes negative. It's pretty clear he is measuring the start of the next El Nino or La Nina at that point, not a feedback response of any sort.
But then he then says "Now, if we assume that the radiative changes AFTER the temperature maximum (or minimum) are mostly a feedback response, then one might argue that the satellite data shows more negative feedback (lower climate sensitivity) than the models do." That is pretty clearly a wrong antecedent, the gains and losses must be mostly forcings to change sign the way he shows. Therefore the conclusion that the models show higher climate sensitivity than satellite is not supported. In that claim he is incorrect.
OTOH, I don't think FG06 can support their claim that I quoted above. Their model is linear, contains no lag and ignores cloud forcings (assumes they are all feedback). With such gross oversimplifications on both sides I can't help but think Spencer is arguing about nothing. I have not looked at Dessler lately, but I will give it another look now. - Journal editor resigns over 'fundamentally flawed' paper by Roy Spencer
Albatross at 02:17 AM on 4 September, 2011
Eric @14,
"So I don't think Wagner is correct that the scientific basis for rejecting SB11 is supported by Trenberth's refutation of LC09."
I am in broad agreement with you. But Spencer and Braswell (2011) [S&B11] do in fact speak to the impact of ENSO on global temperatures, that is where Trenberth et al. (2010) comes into play. How did you miss that? Regardless, you seem to forget the pretty thorough refutation of S&B11 by Trenberth and Fasullo over at RC-- they have identified many problems with S&B11, as have Barry Bickmore and Arthur Smith.
Did you read the article by Dr. Ashely? And this is all before what will probably be a thorough debunking OF S&B11 by Dessler next week.
I'm not sure what you are trying to say here-- can you be clear do you think S&B are correct? Do you think that they used the correct methodology? Do you think that they adequately quantified the uncertainty in their analysis and data? Is Spencer's continued use of his clearly flawed simple model acceptable/appropriate for this study? Is his model physically realistic and plausible?
I agree with S&B11 that disentangling and identifying the cloud feedback is tricky-- Dessler and Trenberth and FG06 seem to agree. But do you not see the obvious logical fallacy here Eric? S&B state that one cannot (with the current observations and observation system) disentangle the two (i.e., conduct a feedback diagnosis), but then go on to repeatedly and very confidently claim that clouds are a forcing mechanism (without providing a sound physical mechanism), that the cloud feedback is negative and that as a result that climate sensitivity is low. That is playing games Eric, that is clearly not science, certainly not good science.
Spencer sees himself as some omniscient maverick who knows the truth while everyone else you disagrees with him is an idiot and/or part of some grand conspiracy led by Al Gore and the IPCC to suppress his genius. Well, the problem is that he does not have a sound track record, previously he has made brazen assertions that have turned out to be incorrect. Worse yet, the physics and data do not support a strongly negative cloud feedback or low climate sensitivity-- at least when analyzed correctly.
Now feel free to hitch your horse to the Spencer et al. drama bandwagon (I hope that you do not) but should you choose to do so, please do not expect others to respect anyone who does so, especially when they are aware of the real facts.
Clearly, Wagner had many very sound reasons for rejecting S&B11, and what he did was the difficult, selfless and honourable thing to do. By doing so he has called 'skeptics' on their game of sneaking seriously flawed papers though the peer-review process, something they have been doing since the early days at ClimateResearch with soon and Baliunas' bogus paper. Ironically, to this day, 'skeptics' cite that incident as a example of alleged "gate keeping", when in fact it was the 'skeptics' who were behaving badly and undermining the peer-review process. Same tricks by 'skeptics', just a different decade and a different journal. - The human fingerprint in the daily cycle
muoncounter at 11:10 AM on 1 September, 2011
Norman#106: Nicely done!
You seem to be suggesting a strong anthropogenic influence over weather conditions. It is nice to hear such an effective rebuttal to 'its not us.'
You're also showing direct evidence that high clouds (formed from contrails) are a strong positive feedback:
Cloud cover subsequently decreased in the west and increased over much of the eastern half of the country during the next two days, producing predominantly negative
three-day OLR changes in the east and positive values in parts of the west.
To rephrase, increased clouds in the east resulted in less OLR, ie, more heat retained. That nicely rebuts such silliness as Spencer's magic clouds and the general desire to hang a negative feedback on clouds (largely because its cooler on cloudy days).
BTW, that also pops the balloon of the GCR argument: if GCRs do in fact stimulate high cloud nucleation (which is not proven), then by the same logic those high clouds contribute to warming, not cooling. You've shown that Svensmark and his adherents have it all backwards!
And certainly there can now be no doubt that sensitivity is quite high, as there were measurable temperature differences for what must be considered a relatively small causal agent.
But your 'manmade but not CO2' doesn't do much. Three days with few contrails do not a multi-year trend make. - There is no consensus
DSL at 22:34 PM on 20 August, 2011
Rickoxo, be careful. You used Anderegg's term "unconvinced" early and then switched to "not agree." Your Newtonian example also devolves into an either-or (and only involves a single idea).
I'll wager that 90% of those 10% agree with much of the basis of AGW but are unwilling to commit for one reason or another. Spencer and clouds, for example. You can be unconvinced by the theories of Freud but also find a lot of truth in them.
As for the earlier complaint about the significance of the human contribution, it's up to the survey taker to interpret significance. If you don't trust the survey maker with the word, how do you answer? This does turn into an either-or if you do use the statistical measure of significance. CO2 is the control knob, and the human injection of atmospheric CO2 has been the difference.
You remain skeptical, though, based on the evidence of surveys. Surveys do not effectively measure the response to the complexity of the theory and, more importantly, its implications. If you're going to leave it at the survey level, then 90% should convince you. If I give you a 90% chance of winning a million dollars with a 10 dollar ticket, I don't think you'll pass the chance on to the next in line. If 90 people tell you you're about to get hit by a bus, and they all give the same reasons, and ten people tell you you're not but all their reasons are different, and some of the ten disagree with others of the ten, are you going to move your butt or keep sauntering? You can answer "I'm not convinced" with your academic mind, but your practical mind is screaming "move it!"
Better yet, though, just work out the basics for yourself. It only takes a few hours--less if you accept certain assumptions. If you accept the absorption spectra of the ten most populous atmospheric gases, and if you accept the evidence of rising CO2 concentrations and the mass balance argument, then you're halfway there. Just accepting those basics will, in fact, stop you from having to read probably half of the "skeptical" arguments rebutted on this site.
I will note that I'm with Sphaerica on this issue. Survey schmurvey. The survey still needs to be interpreted for the public, and the public has been well-trained to say, "yah, but it's just a survey and surveys can say anything." A survey certainly isn't going very far in the professional community. They make great copy for guys like Joe Romm, but he's largely preaching to the choir. - Roy Spencer’s Latest Silver Bullet
Arkadiusz Semczyszak at 17:58 PM on 26 May, 2011
Last few days I analyzed available sources.
... and the all comment bbickmore - I can be (fully) agree with one sentence:
“ Instead of trying to work on his idea until it’s in good enough shape to pass peer review, he posts it on a blog ...”
That's true. Methodological errors in the analysis of Spencer seem to be obvious. But is it important?
1. At the beginning: a simple model (even simpler “than is possible”) for determining the impact of climate on the sensitivity of OHC - are often ( to investigate a specific range of data )better than complicated . Here should not be no doubt. According to the researchers in Australia:“Simple climate models can be used to estimate the global temperature response to increasing greenhouse gases. Changes in the energy balance of the global climate system are represented by equations that necessitate the use of uncertain parameters.”( Utilising temperature differences as constraints for estimating parameters in a simple climate model , Bodman, Karoly and Enting, 2011.)
2. “... and many of these methods are based on paleoclimate data, rather than model output ...”
What does not change the fact that the range of this - just determined the sensitivity - it is very big.
... a 1,3 st. Spencer (even treated: not as a "transient sensitivity"- and as a "finished - all” global sensitivity to a doubling) compared to 1.5 - that is, within the error limits to the range of the IPCC.
... so that Spencer truly „... actually agreed with mainstream climate science ...”, because - as noted above - according to the IPCC: “... could be consistent within their uncertainties but might indicate a tendency of climate models to overestimate ocean heat uptake.”
3. bbickmore of criticism is here not only the model but Spencer and - in a way obvious (though not literally) - the "overarching" results (“...major problems if we continue to burn fossil fuels ...”).
(Hint: I am surprised that every supporter of AGW, no matter what he writes, always has to add something “like that "...)
"Major problems" that those 3 degrees K, if we use - as appropriate - no errors - Spencer simple model based on an analysis of changes in the OHC.
However, we have: "... overestimate ocean heat uptake ... "- How much? For example, recently noted the "problem"with OHT and clouds in the tropics, the "problem" preventing the full potential of OHC - which diminishes the sensitivity of climate to these external factors that directly affect the accumulation of energy in the ocean ( Climate sensitivity to changes in ocean heat transport, Barreiro & Masina, 2011.: „This suggests that the present-day climate is close to a state where the OHT maximizes its warming effect on climate and pose doubts about the possibility that greater OHT in the past may have induced significantly warmer climates than that of today.”).
In addition, the ocean can draw energy, not only passively but actively - bigger (or smaller) regional energy storage by the ocean can be a global positive feedback to the (even smaller - in absolute values) changes in OHT caused by the small (but in a concrete place ) changes in external forcing.
“The influence of ocean circulation changes on heat uptake is explored using a simply-configured primitive equation ocean model resembling a very idealized Atlantic Ocean.”
“Calculating heat uptake by neglecting the existing reservoir redistribution, which is similar to treating temperature as a passive tracer, leads to significant quantitative errors notably at high-latitudes and, secondarily, in parts of the main thermocline.” ( The passive and active nature of ocean heat uptake in idealized climate change experiments , Xie and Vallis, 2011.)
How much - these new observations - the calculation - are significant to the results obtained by other „... many of these methods ...”?
For example, “the skeptical analysis” of claims that only the ocean, "tells the truth", because:
„... ocean heat has one main advantage: Simplicity. While work on climate sensitivity certainly needs to continue, it requires more complex observations and hypotheses making verification more difficult. Ocean heat touches on the very core of the AGW hypothesis: When all is said and done, if the climate system is not accumulating heat, the hypothesis is invalid.”
Ocean - heat content - therefore has an advantage over : “... many of these methods ...”. Less problematic - uncertain - estimates.
4. I therefore consider that although Spencer methodological mistakes - they are insignificant to the correctness of his final conclusions (as noted - in the comments of this post). He is right - paying particular attention to the importance of natural variability - can not (I hope for now) just to prove it properly.
I hope that in this last issue is consensus, ie, he ... “ can not ... "
“Bullet” of Spencer - is just one of many "silver" shot at in the same direction ...? - Lindzen Illusion #6: Importance of Greenhouse Gases
Bob Lacatena at 00:12 AM on 12 May, 2011
54, Camburn,It holds those fixed while changeing one dynamic....
For the last time, you have this 100% wrong, and you will be stalled in your understanding of climate science until you abandon your Wattsian belief system and start to figure out what is really going on.I stated that in the chaotic climate that is not fixed, the results of this study do not apply.
I had not seen this statement, but... why on earth would it not apply?
First, the climate is not (normally) chaotic. Weather is chaotic, but the climate, without forcing, does not vary by more than ± 0.3˚C, and within that, I would doubt that the percent contributions of water vapor/clouds/CO2 vary by much, if at all. In fact, I would doubt that the percentages vary much even in a more chaotic climate, however that remains to be seen/studied/proven.
He has used h20 vapor as a positive forcing.
No. This is more Watts-speak, and comes from your misunderstandings of models.
If nothing else, please review the links at the end of this post.
But in a nutshell, most models (and modelE in particular) are physics based. One does not set parameters. One does not say "I will declare that H2O feedback will be +3.53". They program in the absorption bands of H2O, and the specific heat, and the parameters surrounding evaporation, etc., etc. They let it run, and H2O does whatever it does under the physics programmed into the model.
The fact that all of the models (programmed by different people using different methods and different assumptions) demonstrate the same behavior is one confirmation that they have it right. The fact that real world observations demonstrate very similar behavior in various resulting outputs is another confirmation. The fact that their final global mean temperature of the planet matches reality is another confirmation.
Beyond this, models are not just run once. They are run multiple times, with variations in parameters and random events, so that an ensemble average can be computed.
This stuff isn't done in a vacuum, and it's not done just by setting parameters.
Please read:
FAQ on climate models
FAQ on climate models: Part II
It is also highly recommended that anyone interested in climate science take the time to read Spencer Weart's The Discovery of Global Warming. It is a very easy read, very, very informative, and provides a great foundation for understanding the current state of the science, regardless of whether or not you agree with current conclusions about climate change. - Clouds provide negative feedback
KR at 00:34 AM on 21 April, 2011
RW1 - Let's stay with the standard definitions, OK?
Variation: Periodic (seasons) or aperiodic (ENSO) internal variations in climate that when averaged do not demonstrate a trend.
Forcing: Factor that change from causes external to the climate system, causing trends in temperature. This includes Milankovich orbital changes, insolation, volcanic aerosols, land usage, and anthropogenic CO2.
Feedback: Amplifying or dampening response to climate changes, reactions to long term temperature trends, for example clouds, water vapor, ice coverage/albedo, and long term CO2/ocean/weathering interactions.
---
Back to the thread topic, clouds. Both direct evidence and paleo records indicate that the climate sensitivity is around 3C for a CO2 doubling, and that the cloud feedback is most likely somewhat positive. Slightly negative has not been ruled out, but it's not the mean estimate, either. Strongly negative cloud feedback is extremely unlikely based upon the 3C sensitivity estimate.
Several people (Lindzen, Spencer) have postulated that clouds might change independently from temperature, and can thus be considered a forcing - none of them have presented any physical mechanism whereby this might happen. Lacking that, clouds must be considered a feedback only, not a forcing. - Arctic Ice March 2011
muoncounter at 12:06 PM on 1 April, 2011
johnd#56: "The major factor standing between the incoming solar radiation and the ice will be clouds,"
Indeed. From Kay 2007:
Reduced cloudiness and enhanced downwelling radiation are associated with the unprecedented 2007 Arctic sea ice loss. Over the Western Arctic Ocean, total summertime cloud cover estimated from spaceborne radar and lidar data decreased by 16% from 2006 to 2007. The clearer skies led to downwelling shortwave (longwave) radiative fluxes increases of +32 W/m2 (-4 W/m2) from 2006 to 2007 ...
... we suggest that in a warmer Arctic with thinner ice, cloud and shortwave radiation anomalies will play an increasingly important role in modulating summertime sea ice extent.
So a warmer Arctic summer has decreasing cloud cover, leading to more energy input to the surface. Better hope those Spencer magic clouds are coming to the rescue soon. - Radiative forcing by aerosol used as a wild card: NIPCC vs Lindzen
Chemist1 at 07:23 AM on 23 February, 2011
Albatross, I know. That is my issue with the IPCC. They only do meta analysis, and surveying of other's work, and at times do it well, but very often do it poorly. They also censor other's work that is not on line with a so called consensus.
No, Albatross, there are papers published by Lindzen that describe the power of aerosols, as well as, those by Christy and Spencer. Also I am adding data from other studies showing how aerosols and cirrus clouds interact to form a potent negative feedback.
Decadal time scales are not always the proper procedures when we consider how cloud response times are on the order of 24 hours or so and negative feedbacks are a year or so in length.
Rob: please see Spencer and Christy's work confirming an iris effect with more spatial resolution and temporal analysis. - Empirical evidence for positive feedback
muoncounter at 07:15 AM on 19 February, 2011
co2 "I know that the Sierra alpine glaciers are growing"
Odd that there is no empirical scientific evidence to support this anecdotal evidence. In fact, there is quite a bit of evidence to the contrary:
See this photo comparison from the Univ. of Portland:
Comparisons of the repeat photography reveal that all ten of the glaciers have experienced a reduction in ice volume and surface extent over the past century.
See also the 2009 report of the World Glacier Monitoring Service: all records for US glaciers in 2009 show mass loss. Are you perhaps confusing glacial movement with glacial growth?
"Look at the work of Spencer, Lindzen and others for more details,"
I seem to recall that we are still waiting for Spencer's 'magic clouds' to bring negative feedback to the rescue. Dessler and Sherwood 2009 have quite a different view on that feedback. See also Vavrus 2004:
Compared with this fixed-cloud experiment, the simulated cloud changes enhance greenhouse warming at all latitudes, accounting for one-third of the global warming signal. This positive feedback is most pronounced in the Arctic, where approximately 40% of the warming is due to cloud changes. The strong cloud feedback in the Arctic is caused not only by local processes but also by cloud changes in lower latitudes, where positive top-of-the-atmosphere cloud radiative forcing anomalies are larger.
Any further comments regarding cloud feedbacks, if any are still necessary, should go to the appropriate thread. - Empirical evidence for positive feedback
co2isnotevil at 19:53 PM on 18 February, 2011
muoncounter,
I know that the Sierra alpine glaciers are growing because my friends and I have been skiing them all summer for 20+ years and there's a clear progression from year to year. They grew for a while, shrank or stayed about the same for a decade and have started growing for the last 3 years and most likely again this year.
As for positive water vapor feedback, this is absolutely incorrect when clouds are considered a water vapor influence. Look at the work of Spencer, Lindzen and others for more details, or just look at the actual data (instead of highly processed anomaly plots). Of course, this presupposes you have a strong background in thermodynamics, control theory and more, rather than just faith in another persons interpretation, This article claims empirical evidence supporting positive feedback, but the evidence cited is nothing more than unsupportable conclusions based on preconceived bisses. - How We Know Recent Global Warming Is Not Natural
Albatross at 06:14 AM on 8 February, 2011
Dana, you have exceeded your usual high standards with this post.
Regarding Spencer's challenge. It is iMHO very underhanded of him and probably an effort to fabricate "debate". It also just reinforces pre-conceived notions by some that the mainstream climate science ignores natural variability (which is most definitely does not, start reading the IPCC report here) or that the warming can me attributed to some mystical, hitherto undiscovered driver. The scientific literature abounds with example of papers investigating the role of natural variability on regional and global temperatures and precipitation.
Spencer's "challenge" really does smack of desperation and wishful thinking.
Regarding clouds, that is a tricky one. As Norris (an expert in the field) data issues are a limiting factor in elucidating the role of clouds (see Norris and Slingo (2009). That said he has tried, very hard I might add, to identify trends in low clouds and their possible contribution to the observed temperature changes. His recent paper in Science (Clement et al. 2010) finds evidence for a positive feedback, with warming leading to decreased low-level cloud cover which in turn causes more warming.
In a presentation made by Norris in 2009, he made the following statements after considering all the best available data:
And from Norris' "summary":
• cloud changes since 1952 have had a net cooling effect on the Earth
He also of the opinion that:
"internal climate variability is unlikely to produce cloud trends occurring over the length of 46 years
• anthropogenic or natural external forcing is unlikely to directly produce the observed cloud trends
• an internal response of the climate system to external forcing could produce the cloud trends
• there is not yet enough information to attribute the cloud trends to anthropogenic global warming" - How We Know Recent Global Warming Is Not Natural
Dikran Marsupial at 22:30 PM on 7 February, 2011
Kevin C "Spencer has a hypothesis involving clouds, it's just not fleshed out to the same level of detail as the mainstream CO2 hypothesis."
That is essentially my point, Spencer has a hypothesis, but it is not yet a scientific hypothesis as it hasn't reached the point where it can make prohibitions on what we can observe so that it has the potenital of being falsified even if it is false. Until the null hypothesis is well-defined is meaningless to ask for papers where it has been rejected.
The funny thing is that climate modellers are perfectly happy to tell you what is consistent with climate variability, just look at the spread of the model runs (it is why model ensembles are useful). So we are in the funny situation where a challenge has been laid down where the challenger (apparently) won't say what is consistent with "natural variability" is, and won't accept the answers of climate modellers who will! - How We Know Recent Global Warming Is Not Natural
Kevin C at 22:01 PM on 7 February, 2011
Actually, I think it is a little more subtle than a simple falsification question. If the 2nd-hand sources I'm reading are correct, Spencer has a hypothesis involving clouds, it's just not fleshed out to the same level of detail as the mainstream CO2 hypothesis.
So the ideal here would be to develop a detail climate model based on Spencer's hypothesis and test its performance against existing climate models. It might perform better or worse, although I'd expect several iterations of peer review before drawing a fair conclusion.
But here we run into a difference between 'the scientific method' and 'how science is done'. What I've described above is consistent with the scientific method (falsification, Bayes, etc), but falls down in practice because resources are finite. The system as described could be sabotaged by a flood of underdeveloped hypotheses which need to be tested and falsified. Indeed this may already be happening.
'How science is done' brings in extra factors - peer review, consensus. Things which have evolved as practical measures to make science work reasonably efficiently. Peer review as a junk filter, consensus as a mechanism to say 'stop - we've tested this hypothesis enough different ways, we haven't proven it (and never will), but it is good enough to be going on with'. Without these, science becomes bogged down (and thus Delingpole's peer-to-peer science can never work - under his model biology would do nothing but retest the theory of evolution over and over again to try and satisfy the IDers).
So, I think on the basis of 'how science is done', the onus is on Spencer to demonstrate that his model can provide predictions which are both testable and as specific, and at least comparable to those provided by existing models. If he can do that, the 'the scientific method' will come into play to test them further.
I may of course be giving him too much benefit of the doubt - after all I haven't read his papers and would not be qualified to judge them if I did. - Could global warming be caused by natural cycles?
Arkadiusz Semczyszak at 19:09 PM on 13 January, 2011
A few remarks.
1. While discussing the natural cycles need to refer primarily to the work of R.W. Spencer and J.R. Christy. On the "incentive" I would recommend this graph R.S..
2. Stratospheric temperature decreased after each volcanic eruption and then very slowly growing. Of changes in water vapor in the stratosphere - from an unknown (to end) reasons (falling since 2000 - research by S. Solomon) - You can not "isolate" sufficiently closely the possible impact of GHG troposphere - on temperature of the stratosphere.
3. Superposition of cycles, cycles of simple summation of phases = cycles of unknown origin (eg, millennium cycle) - this field of knowledge which is at the beginning of "way of knowing. "
2. Warming is forever GHG. Natural cycles - the sun - the temperature increase - followed the water vapor content and CO2, CH4 (respiration, deep ocean ventilation) in the atmosphere - the dominance of marine circulation - usually western circulation (especially in Europe, Antarctica) = the natural greenhouse effect.
... and a sea climate - winter and the nights are always warmer than the continental climate - the minimum temperature is growing faster - than the maximum temperature.
Eg. Africa - Middle East. 13C and 18O of wood from the Roman siege rampart in Masada, Israel (Ad 70–73): Evidence for a less arid climate for the region, Yakir et al., 1994.:
“The ancient tamarix cellulose is depleted in both 13 C and 18 O compared to cellulose from trees growing in the Masada region today. Similar trends were observed on comparing modern tamarix trees growing in the Negev Desert with those growing in the temperate climate of central Israel. Considering the factors that can contribute to the observed changes in isotopic composition, we conclude that the ancient trees enjoyed less arid environmental conditions during their growth compared to contemporary trees in this desert region.”
Climatic effects on the δ 18 O and δ 13 C of cellulose in the desert tree Tamarix jordanis, Lipp et al., 1996.:
“Since the Roman period, RH at Masada decreased by about 17% [!], while the δ 18 O value of local groundwater remained similar to present-day values, suggesting that changing atmospheric circulation has played a role in climate change in the Middle East over the past two millennia.”
Stable isotopes of a subfossil Tamarix tree from the Dead Sea region, Israel, and their implications for the Intermediate Bronze Age, Frumkin, 2009.:
“The Sedom Tamarix demonstrates a few hundred years of 13 C and 15 N isotopic enrichment, culminating in extremely high δ 13 C and δ 15 N values. Calibration using modern Tamarix stable isotopes in various climatic settings in Israel shows direct relationship between isotopic enrichment and climate deterioration, particularly rainfall decrease.” “This was apparently the most severe long-term historical drought that affected the region in the mid-late Holocene.”
The latest version of the report being prepared IPCC I would agree only with those conclusions:
“It is very likely that glacial-interglacial CO2 variations have strongly amplified climate variations, but it is unlikely that CO2 variations have triggered the end of glacial periods. Antarctic temperature started to rise several centuries before atmospheric CO2 during past glacial terminations.”
3. Tropical - solar cycle - fingerprint looks like this: Amplifying the Pacific Climate System Response to a Small 11-Year Solar Cycle Forcing, Mheel et al., 2009.: “One of the mysteries regarding Earth's climate system response to variations in solar output is how the relatively small fluctuations of the 11-year solar cycle can produce the magnitude of the observed climate signals in the tropical Pacific associated with such solar variability.”
4. Using relevant filters, we find a much larger (0.07% TSI) and the cyclical variation in TSI over the past 250 years. Jeffrey A. Glassman, PhD
5. High solar activity cycle such as 6 thousand. years - volcanic eruptions - the XIX - XX-cycle - a decrease of ozone - a decrease of phytoplankton - the weaker “damping” of EN(LN)SO (comment 35) - more frequent and more rapid changes in the EN-LN - and for example a great floods ... - A Positive Outlook For Clouds
Arkadiusz Semczyszak at 02:10 AM on 4 January, 2011
As for the work of A. Dessler, based mainly on models - I remind comment R. Spencer from 09.12.10 and 31.12.2010. (e-mail exchange between A.D. and R.S.), and A. Dessler – RealCimate (09.12.10).
For me, it is important - here - the sentence of R. S.: “What we demonstrated in our JGR paper earlier this year is that when cloud changes cause temperature changes, it gives the illusion of positive cloud feedback – even if strongly negative cloud feedback is really operating!”
By R.S. drop area of low clouds, which results in increase in the share of high clouds - stopping LV (alleged positive feedback described by AD) - "was the first" - is the reason for the current increase temperatures.
“Low-cloud feedback has a strong amplifying impact on the tropical ITCZ shift in this model, whereas the effects of high-cloud feedback are weaker.” - this result was obtained when tested AMOC (Sensitivity of Climate Change Induced by the Weakening of the Atlantic Meridional Overturning Circulation to Cloud Feedback, Zhang, Kang and Held, 2009.), which weakens in warm periods.
Negative opinion of low clouds can be up to 4 times higher than assumed in the models, which used the A.D.: Is There a Missing Low Cloud Feedback in Current Climate Models? Stephens, 2010.: “The consequence is that this bias artificially suppresses the low cloud optical depth feedback in models by almost a factor of four and thus its potential role as a negative feedback. This bias explains why the optical depth feedback is practically negligible in most global models (e.g., Colman et al., 2003) and why it has received scant attention in low cloud feedback discussion.”
I also think that the changes in low clouds (decrease) precede warming - and I have a "strong" evidence.
What could be the reason? Svensmark's theory is according to the latest data for only a few percent of cloud cover (eg: Kulmala et al., 2010.). However, note that after the explosions of volcanoes (El Chichon in 1982 and especially Mt. Pinatubo 1991) observed a significant decrease in regional and global NPP, which is difficult to explain short-term (1-3 years) cooled. NPP only now reached the level prior to 1992 (Mt. Pinatubo).
Here you can see that ozone levels are lowest circa 1992-1999 ( graph second from the top - on the second slide).
The reaction is a bit low clouds shifted over time: Decreasing cloud cover - now slightly increases - such as ozone.
This paper: Factors affecting arctic ozone variability in the Arctic, Weatherhead et al., 2010., shows why the fall of ozone in the atmosphere - especially topic of water vapor in the stratosphere is interesting (delaying the restoration of ozone).
In the tropics, ozone (rzem the sun) strongly influences the clouds: Amplifying the Pacific Climate System Response to a Small 11-Year Solar Cycle Forcing, Mheel et al., 2009.: “One of the mysteries regarding Earth's climate system response to variations in solar output is how the relatively small fluctuations of the 11-year solar cycle can produce the magnitude of the observed climate signals in the tropical Pacific associated with such solar variability.” “Two mechanisms, the top-down stratospheric response of ozone to fluctuations of shortwave solar forcing and the bottom-up coupled ocean-atmosphere surface response, are included in versions of three global climate models, with either mechanism acting alone or both acting together.” “... during peaks in the 11-year solar cycle ... ...reduce low-latitude clouds to amplify the solar forcing at the surface.”
Let's go back to NPP - phytoplankton - effects of ozone and ENSO (please note here, however, with regard to this work: Lack of correlation between chlorophyll a and cloud droplet effective radius in shallow marine clouds, Miller and Yuter, 2007. - “The interactions among aerosols, cloud properties, boundary layer dynamics, surface processes, and radiative effects are complex and can be non-monotonic ...”).
: “The regions with higher DMS emissions show an increase in CDNC, a decrease in cloud effective radius and an increase in cloud cover.” “We estimate a maximum decrease of up to 15–18% in the droplet radius and a mean increase in cloud cover by around 2.5% over the southern oceans during SH summer in the simulation with ocean DMS compared to when the DMS emissions are switched off. The global annual mean top of the atmosphere DMS aerosol all sky radiative forcing is −2.03 W/m2, whereas, over the southern oceans during SH summer, the mean DMS aerosol radiative forcing reaches −9.32 W/m2.”
Quantification of the Feedback between Phytoplankton and ENSO in the Community Climate System Model, Jochum et al, 2010. - shows that both the ENSO influence on phytoplankton, and phytoplankton affect ENSO.
Production and Emissions of Marine Isoprene and Monoterpenes: A Review, Shaw, Gantt, and Meskhidze, 2010. - This review shows that according to numerous works, the impact of aerosols originating from the biosphere (including phytoplankton) can be decisive for the low clouds - and: Global phytoplankton decline over the past century, Boyce et al., 2010..
The first important work that indicates that ozone may have a significant impact on phytoplankton (DMS as a consequence of aerosol - a cloud low) was: Ozone depletion may leave a hole in phytoplankton growth, Andrew Davidson, Kelvin Michael, Manuel Nunez, Simon Wotherspoon and Ben Raymond, 2006. – with relation to this work: - we read: “New research suggests that the growth of phytoplankton is reduced by 56% when stratospheric ozone drops below 17% or less than 300 Dobson Units (DU).”
But in another relation: Ozone hole alters Antarctic sea life, Emma Young, 2006., , is sentence: „However, Kevin Arrigo at Stanford University, California, says that on average, chlorophyll concentrations in Antarctic waters under the ozone hole have not changed since the late 1970s, when stratospheric ozone was much higher than today.”
K. Arrigo also has estimated that: Primary production in the Southern Ocean, 1997-2006, Arrigo, van Dijken, and Bushinsky, 2008. - “Unlike the Arctic Ocean, there was no secular trend in either sea ice cover or annual primary production in the Southern Ocean during our 9-year study.”
For 1997 - 2006 agreement. However, for the years 1987 - 2004, it was found that: Stratospheric ozone depletion reduces ocean carbon uptake and enhances ocean acidification, Lenton et al., 2009. - “We find that Southern Ocean uptake is reduced by 2.47 PgC (1987–2004) and is consistent with atmospheric inversion studies.”
UVR indisputable impact on the primary production in Antarctic waters this work states:
Temporal changes in effects of ambient UV radiation on natural communities of Antarctic marine protists, Thomson, Davidson, and Cadman, 2008.: “This recurrent decline in ozone over Antarctica between January and April coincides with blooms of diatoms that appear to have low UV-B tolerance but are responsible for ~47% of annual primary production in Antarctic waters.”
And this paper: Ozone depletion: ultraviolet radiation and phytoplankton biology in antarctic waters, Smith et al., 2009. - “A minimum 6 to 12 percent reduction in primary production associated with O3 depletion was estimated for the duration of the cruise.”
- It is noteworthy that in this figure, however, changes in chlorophyll usually precede changes in temperature. Figure adapted from: Satellite-detected fluorescence reveals global physiology of ocean phytoplankton, Behrenfeld et al., 2009. - An Even Cloudier Outlook for Low Climate Sensitivity
HumanityRules at 14:57 PM on 16 December, 2010
From Spencer 2010
"Evidence for this process was shown by Spencer et al. [2007] in their analysis of a composite of 15 strong tropical intraseasonal oscillations, where strong warming events in the tropical troposphere [el Nino] were accompanied by weak SST cooling. This process was driven by stronger surface winds temporarily enhancing the heat flux from the ocean to the atmosphere."
Clouds cause ENSO???? It's far easier to see what these scientists think when you read their science. - An Even Cloudier Outlook for Low Climate Sensitivity
HumanityRules at 12:52 PM on 16 December, 2010
100 e
I agree with you Spencer is saying (some) temperature change is initiated by clouds not that ENSO is initiated by clouds.
102 dhogaza
I read the email exchange, I don't see where he says or infers "ENSO are caused by clouds". Please reproduce the quote here so I can find it in the emails.
96 Stephen Baines
Stephen you fail to mention deltaT here and it seems to be the relationship between clouds and deltaT that Spencer is arguing over not ENSO. I think when it comes to "initiators" and "feedback" it's the relationship to deltaT that Spencer is concerned about.
Anybody want to move on from this and talk about phase space plots? - An Even Cloudier Outlook for Low Climate Sensitivity
Albatross at 11:05 AM on 16 December, 2010
HR,
I think that you might also be going off on a "flight of fancy" when you suggest "The power of that argument is to place Spencer so far outside the mainstream as to discredit everything he says".
I would argue that Spencer's behavior and comments in recent years (many of which were made on his own blog) are in fact doing just that (i.e., discrediting him). Dessler strikes me as a sincere person who is not likely to engage in the tactics that you are accusing him of. Also, I do not see Dessler et al. holding a press conference the very minute a "skeptic" paper is officially released in order to try and sabotage it. It is Spencer who is playing games, not Dessler.
The logic of the contentious statement that Spencer made in his email definitely suggests that for the 2007-2008 La Nina, changes in clouds preceded changes in temperature. Now in Spencer's defense, it was an email, which is a horrible medium for communicating sometimes. Maybe he was simply not clear or mis-spoke. What I do not understand is why Spencer has not spoken up to clarify his position since Dessler made his post at RC, or why he did not take the opportunity to discuss the matter further by email with Dessler.
This whole ENSO fiasco is just a distraction though. Dessler's main points are that the cloud feedback in response to warming is very likely positive and that the models are doing a pretty good job in reproducing this short-term (positive) feedback.
Anyone still trying to claim that climate sensitivity is low, is on incredibly thin ice-- some might even go so far as to say that they are already flailing in the water. - An Even Cloudier Outlook for Low Climate Sensitivity
HumanityRules at 10:39 AM on 16 December, 2010
91 NewYorkJ 93 dhogaza
You could also try this on Spencer's blog
I'll even copy the relevent bit for you
"To Dessler’s credit, he actually references our paper. But he then immediately discounts our interpretation of the satellite data.
Why?
Because, as he claims, (1) most of the climate variability during the satellite period of record (2000 to 2010) was due to El Nino and La Nina (which is largely true), and (2) no researcher has ever claimed that El Nino or La Nina are caused by clouds.
This simple, blanket claim was then intended to negate all of the evidence we published.
But this is not what we were claiming, nor is it a necessary condition for our interpretation to be correct. El Nino and La Nina represent a temporary change in the way the coupled atmospheric-ocean circulation system operates. And any change in the atmospheric circulation can cause a change in cloud cover, which can in turn cause a change in ocean temperatures. We even showed this behavior for the major La Nina cooling event of 2007-08 in our paper!
It doesn’t mean that “clouds cause El Nino”, as Dessler suggests we are claiming, which would be too simplistic and misleading of a statement. Clouds are complicated beasts, and climate researchers ignore that complexity at their peril."
These are Spencer's words, not Dessler's interpretation of Spencer's words. It can't be any clearer that he does not hold the view that Dessler assigns him. I understand what Spencer is saying here and I'm not a climate scientist. He's not arguing clouds cause ENSO, he's questioning the assumptions about the relationship between clouds and temperature. In Spencer's first email he says clouds proceed temperature, not clouds proceed ENSO. It's Dessler that seems to think that this means ENSO is caused by clouds.
My reading of Spencer's work is to try to understand what he calls "internal radiative forcing" and other's call "unforced internal variability". This isn't just his theory, what's novel about Spencer's work seems to be in the understanding of how these processes affect the measurement of short term radiative forcing.
While Spencer goes off on a flight of fancy about the timing of the publication, and should really hold his head in shame over that, I do think he has a point about Dessler's use of the "clouds cause ENSO" arguement. The power of that arguement is to place Spencer so far outside the mainstream as to discredit everything he says. It's no more worthy a tactic than Spencer's conspiracy theory and no better at discrediting the science. - An Even Cloudier Outlook for Low Climate Sensitivity
Eric (skeptic) at 22:28 PM on 15 December, 2010
Albatross (#83), I was incorrect in #80 (answering your #77). I read the paper body (p. 1525) and forgot about the caption where Dessler only plotted ECMWF, not MERRA. When I looked them up originally I found the MERRA tech report which explained assimilation very nicely so I used that. I need to find a similar reference for ECMWF. Both "reanalyses" (i.e. models with data assimilation) are used in the same way for his conclusion (the models with real world data matches the models without). My argument is that the cloud parameters are internal (at least in MERRA) and therefore depend on the radiation, convection and cloud process equations plus an assortment of parameters which are determined by fitting the model to the real world data. I think my argument will apply to ECMWF, but I will have to look that up to find out their model details, particularly for clouds.
Sorry about the confusion (starting with my #16). Obviously I need to look at Spencer next. I am pretty sure that you are correct that his model is too simple and that his model assumptions are what creates his result independently of the real world measurements. I'll also try to evaluate how he states and tests his hypothesis. Dessler was quite clear about his. - Ocean acidification isn't serious
muoncounter at 14:00 PM on 15 December, 2010
#42: "outgassing from a warmer ocean affects atmospheric CO2 concentrations significantly"
I'm not referring to RSVP's mathiness. Papers are practically screaming that the oceans are sucking up CO2 to what will become dangerous levels (at least to plankton) in not very many years. From McNeil and Matear 2008,
Southern Ocean acidification via anthropogenic CO2 uptake is expected to be detrimental to multiple calcifying plankton species by lowering the concentration of carbonate ion (CO3-2) to levels where calcium carbonate (both aragonite and calcite) shells begin to dissolve. ... Southern Ocean wintertime aragonite undersaturation is projected to occur by the year 2030 and no later than 2038.
On the other hand, the language of outgassing is very complicated, as in Lovenduski et al 2006:
In contrast, there is a simultaneous anomalous uptake of anthropogenic CO2 during a positive phase of the SAM in the southernmost regions of the Southern Ocean, due to increased upwelling of deep, older waters and their subsequent exposure to higher atmospheric CO2 levels. The anthropogenic uptake only slightly mitigates the natural outgassing from the Southern Ocean, so that a positive SAM is associated with anomalous outgassing of contemporary CO2. In a future characterized by higher atmospheric CO2, however, positive phases of the SAM may be associated with a greater oceanic uptake of anthropogenic CO2.
And they say clouds are complicated beasts? - An Even Cloudier Outlook for Low Climate Sensitivity
Albatross at 02:56 AM on 15 December, 2010
HR @75,
"Do those few data points have a larger impact on the slope of the graph than the pile of data points in the middle?"
That is a possibility. But is hard to say without having access to the data. Dr. Dessler realizes that there is not much data here-- even thought the ECMWF-interim data go back to 1989, CERES was launched on board NASA's Terra satellite in late 1999 (apparently a CERES instrument was launched on board TRMM in late 1997, but I'm not sure why they did not use those data, maybe there were issues with the early instrument?). Given the relatively limited data (120 data pairs), Dessler has answered your question when he says:
"Obviously, the correlation between DRcloud and DTs is weak (r^2 = 2%), meaning that factors other than Ts are important in regulating DRcloud. An example is the Madden-Julian Oscillation (7), which has a strong impact on DRcloud but no effect on DTs. This does not mean that DTs exerts no control on DRcloud, but rather that the influence is hard to quantify because of the influence of other factors. As a result, it may require several more decades of data to significantly reduce the uncertainty in the inferred relationship."
My read of this paper is that it is a sincere and honest effort to address an important, but vexing, problem in climate science. I have to yet come across the "ideal" data set in my field, you do the best with what you have. Dessler has developed and tested a methodology which can be applied in the future as more data becomes available. That, contrary to what Dr. Spencer might believe, is a step forward for science-- something that Dessler seems genuinely concerned and passionate about.
The novelty and strength of this paper lies in the fact that, unlike LC09, Dessler is looking at global data and that his approach implicitly includes clouds of all types (i.e., other studies have focused on just low clouds, for example).
Finally, this paper, demonstrates that the models are (in the short-term at least) actually doing a decent job in simulating the cloud feedback the short-term, and is also further evidence that (while not discounting the possibility of a very weak feedback) that a cloud feedback is in all likelihood positive, with an approximate 95% confidence interval (equivalent to about 2 sigma) of the mean of +0.54 W/m^2/K between -0.2 and 1.3 W/m^2/K.
I would also suggest reading the very last paragraph of his paper starting with "For the problem of...". - An Even Cloudier Outlook for Low Climate Sensitivity
dana1981 at 11:58 AM on 13 December, 2010
I've read both Spencer's blog and the email exchange between Spencer and Dessler, and honestly I can't figure out what Spencer is trying to argue. He says Dessler is wrong, but never clearly explains why. He claims it's an oversimplification to say that he's claiming cloud changes cause ENSO, but he never clearly explains his theory. Basically it seems to boil down to "Clouds are complicated beasts". Well gee, thanks for clarifying!
But the bottom line is that if cloud changes aren't causing temp changes via ENSO changes, then they're acting as a temperature feedback, and Dessler's approach is correct, because ENSO is dominating the short-term temp changes. - Guest post: scrutinising the 31,000 scientists in the OISM Petition Project
Daniel Bailey at 01:05 AM on 11 December, 2010
Re: NQ/A (108)
That depends. If you are asking me to prove the non-existence of something (which would be a silly request), then I could not do that.
Scientists follow the Scientific Method:1. Define the question
The hypothesis that is best supported by all of the data is the one that gains eventual acceptance by other scientists. Over time, an accepted hypothesis can be verified sufficiently to become a theory. That is where the field of global warming is: Theory.
2. Gather information and resources (observe)
3. Form hypothesis
4. Perform experiment and collect data
5. Analyze data
6. Interpret data and draw conclusions that serve as a starting point for new hypothesis
7. Publish results
8. Retest (frequently done by other scientists)
Per the National Academy of Science in their publication Advancing the Science of Climate Change:"A strong, credible body of scientific evidence shows that climate change is occurring, is caused largely by human activities, and poses significant risks for a broad range of human and natural systems….
“Very likely” means a greater than 90% likelihood of probability. I.e., pretty certain.
Some scientific conclusions or theories have been so thoroughly examined and tested, and supported by so many independent observations and results, that their likelihood of subsequently being found to be wrong is vanishingly small.
Such conclusions and theories are then regarded as settled facts.
This is the case for the conclusions that the Earth system is warming and that much of this warming is very likely due to human activities."
So, in order to overturn the anthropogenic attribution of global warming, what must a scientist do? Find a viable physics-based alternative to one of the points in this chain:1. Increasing the level of a greenhouse gas in a planet’s atmosphere, all else being equal, will raise that planet’s surface temperature.
Plenty have espoused alternative theories on blogs, but none have been able to survive scrutiny in a peer-reviewed publication.
2. CO2 is a greenhouse gas.
3. CO2 is rising.
4. Therefore (given 1-3 above) the Earth should be warming.
5. From multiple converging lines of evidence, we know the Earth is warming.
6. The warming is moving in close correlation with the carbon dioxide.
7. The new CO2 (as shown by its isotopic signature) is mainly from burning fossil fuels.
8. Therefore the global warming currently occurring is anthropogenic (caused by mankind).
So have any scientists, using all of the data, been able to break the above chain? None that I'm aware of. Fossil fuel interests spend hundreds of millions of dollars in the US every year to lobby against any controls on fossil fuels and CO2 emissions. Vast riche$ await anyone who can scientifically break the chain of evidence & show the AGW is a non-worry (I'd chip in a couple of hundred myself).
Spencer is probably the closest to a competent scientist among the denialarati. Per the Dessler/Spencer emails, Spencer believes clouds cause ENSO...
So the real question is: have you found any scientist that claims to have overturned AGW? If so, who was it? In what peer-reviewed publication was their work published? Have they presented their proof to those meeting in Cancun yet?
I have no wish at all for AGW to be real. You have no idea the amount of sleep I've lost over the years because of it. The thought of the world I bequeath to my young children and their children...
NQ/A, with the caveat that this is a hypothetical question for thought purposes alone and answering will not constitute an admission of belief in AGW, if AGW is real and all of the predictions come true, what will you say to your grandchildren when they come to you and ask you what you did to try and stop it?
Just curious.
The Yooper - A Cloudy Outlook for Low Climate Sensitivity
Norman at 22:55 PM on 10 December, 2010
#115 syphax,
I went to the link you posted (RealClimate). I read the posts below and it is the same I read everywhere including this site. Many questions and a lot of opinions but still no real solid undebatable answers. CO2 will produce warming of the Earth. How much is the big unknown. The cloud issue seems to be the most mysterious of all the factors. No clouds or water vapor feedback and a doubling of CO2 gives a 1.2 C warmup. That is about the only number I see given that most agree to (both camps).
On the cloud issue I believe Spencer's view has a logical basis. The observation is less clouds and a warmer ocean. One conclusion feels a warmer ocean produces less clouds, another feels that the fewer clouds warm the ocean (more direct solar radiation gets absorbed).
If not for clouds the Earth's total albedo would be around 0.15 and the Earth would be much warmer (The albedo calcualtor indicates about 20F). With clouds the Earth's albedo is 0.3. So some types of clouds may warm the Earth depending upon the thickness, the location and the time of cloud development (night clouds keep the night from cooling as much, thick day clouds in the summer greatly reduce the high temperature, anyone can get this information from personal observations), but overall clouds must cool the earth because of their overall effect on albedo. - A Cloudy Outlook for Low Climate Sensitivity
Eric (skeptic) at 22:47 PM on 7 December, 2010
My unexemplary example of GCR is now sleeping ferociously. As I pointed out over and over, there are many such factors, celestial, lunar (tide shifts), solar (UV, x-ray, electric field effects, etc). Most of these affect clouds and weather. All are ignored by models. All are ignored by paleo studies. All can be individually shown to have no linear effect on temperature over the last 30 years. That leaves CO2 which is a very adequate explanation plus/minus PDO.
But this thread is about sensitivity and the role of clouds. The analysis of the last 30 years doesn't say a lot about sensitivity except that it varies. Right now we might be 2C per century, but maybe just 1C (considering that 1998-sized El Nino might have gotten us 0.1C above current temps). The sensitivity depends, in great measure, on those external factors. They could align and amplify CO2 warming, or damp it or do nothing as a whole. They are not very predictable. They are the wild card over the long run (with ocean cycles causing the short run fluctuations). Also they are independent of Lindzen/Spencer weather sensitivity. - A Cloudy Outlook for Low Climate Sensitivity
Albatross at 02:30 AM on 7 December, 2010
Mark R @70,
"They think that in a warmer world, clouds will change to have a larger cooling effect than they do now."
Three points.
One, sorry but what they "think" is not good enough for me, and it should not be good enough for you either. Wishful thinking is not going to get us out of this mess.
Two, Lindzen says climate sensitivity for doubling CO2 is around +0.5 C, which suggests that a strong and negative cloud feedback should have kicked in after we warmed by about +0.5 C. The planet has not yet and we have warmed by over 0.8 C (for a 40% increase in CO2), and the rate of long-term warming continues at 0.15 to 0.2 C per decade.
Three, Spencer estimates climate sensitivity (for fast or Charney feedbacks) near +1.7 C. Over three times higher than Lindzen, and withing the range specified by the IPCC. So even Lindzen and Spencer are at odds....
I repeat my question from earlier. When is this alleged significant negative cloud feedback going to kick in? It did not kick in after +0.5 C warming as Lindzen's work suggests it should have. The mystic "iris affect" is now looking to be on as shaky ground as the long-debunked GCR fiasco. - A Cloudy Outlook for Low Climate Sensitivity
MarkR at 20:27 PM on 6 December, 2010
RE: #10 David Horton =
Lindzen and Spencer's position makes sense. They think that in a warmer world, clouds will change to have a larger cooling effect than they do now. This _is_ a long term solution and it leads to a lower climate sensitivity than the IPCC give.
We could probably risk 1,200 ppm CO2 if their strongest hypothetical values are right. - A Cloudy Outlook for Low Climate Sensitivity
Eric (skeptic) at 09:45 AM on 6 December, 2010
archiesteel, TSI is not a very useful measurement. UV and other components are more useful since UV modulates blocking and blocking modulates sensitivity. By damping I meant that about 1/2 of man's contribution of CO2 to the atmosphere is absorbed by nature. Since I can't predict solar and GCR, I can't say whether it will mitigate or worsen AGW.
Dana, thanks for addressing my assertions, hopefully I can clarify and maybe some are still wrong after I do. I definitely consider CO2 as a forcing, but it has also been considered a feedback in various threads including the paleo sensitivity threads where it is (IMO incorrectly) considered to be the primary feedback, so that's why I mentioned that. The recent warming (2C per century peak rate) has had many short term fluctuations, hardly representative of the long term sensitivity. I agree with your third point, but it consists of a modest warming effect from GHG before considering sensitivity. Methane varies greatly in the short term and no long term sensitivity conclusions can be made. I agree with your fifth point because water vapor will increase on average with evenness being the big unknown.
My argument is a little different Lindzen and Spencer as I see a greater effect from external factors, not in their models and not in their critics models, on clouds. You previously dismissed GCR in the thread I linked to only by hypothesizing it as the only factor, comparing the linear trend with linear temperature trend and seeing no correlation. But the only possible conclusion is that GCR did not exceed other factors in the last 30 years, not that GCR has no influence. It clearly has a substantial influence on clouds, but those cloud changes do not directly control temperature but mostly weather. In the past 30 years, other factors, both terrestrial and not, have had a larger influence on weather. The reaction of weather to these factors is what sensitivity is. - A Cloudy Outlook for Low Climate Sensitivity
Nick Palmer at 05:24 AM on 6 December, 2010
I don't know enough about the physics of clouds to be certain, so I might sound a bit naive by saying the following.
Isn't the Lindzen/Spencer scenario that the small increase in planetary average temperature from increasing CO2 will cause the relative humidity to increase, primarily in the troposphere - extra water vapour will be present and will lead to the formation of larger, or more numerous, clouds, which will reflect back sunlight thus cooling us back down in a negative feedback?
Where I might be naive is that, as a hang glider pilot, I know, because I have felt it (we're right out in the air flow) that in the gaps between the clouds there is plenty of water vapour too. If Lindzen et al speculate that the feedback from increasing water vapour is negative because of the increase in planetary albedo due to more clouds, have they fully taken into account the increased greenhouse effect from the un-condensed water vapour in the space between the clouds, the area of which is usually much greater than that of the clouds themselves... Comments? - A Cloudy Outlook for Low Climate Sensitivity
David Horton at 18:27 PM on 5 December, 2010
What I have never understood about the Lindzen-Spencer position is what do they see happening in the longer term? The clouds don't stop the CO2 build up, so even if they were right, the rise and rise in greenhouse gas concentrations would overwhelm the cloud effect. Or do they imagine cloud cover getting thicker and thicker for the rest of the century keeping pace with rising CO2? And what would be the effect of that on agriculture and the environment?
The only relevant negative feedback would be one that began removing CO2 faster than we could pump it into the atmosphere, and there is, sadly, nothing that can do that. And yet people keep quoting Spencer as if this clouds are some kind of serendipitous mechanism that will providentially save us all, no need to worry, keep burning fossil fuel as fast as you like. Or am I missing something in the logic of all this? - How significance tests are misused in climate science
Berényi Péter at 09:33 AM on 21 November, 2010
#70 Dikran Marsupial at 22:10 PM on 18 November, 2010
Is the theory of evolution scientific?
I am not aware of a single well defined scientific theory of evolution. If you mean that vastly American idiosyncrasy, the so called Evilution vs. Cretinism controversy, I refuse to play that game.
There are specific theories of various aspects of the overall evolution process that can be called scientific, none of them based on induction.
If you mean the simple observation the geological record is full of fossil remnants of extinct species, that's not a theory, just a bunch of facts begging for a theoretical explanation. Some attempts of such an explanation may be inherently scientific in nature, others are not so much.
Early theories like Lamarckism, Spencerism or Darwinism are already falsified, at least to the extent they were specific enough in their predictions and proposed mechanism behind phenomena observed to lend to a well defined logical procedure as falsification.
There's also a cohort of recent theories going under the umbrella term Neo-Darwinism, all based on a unification of ideas from Alfred Russel Wallace (a spiritualist) and Gregor Johann Mendel (an Augustinian monk). It is not a unified theory either, just a meta-theory, which encouraged the formation of various scientific theories, some of them still standing.
There is nothing specifically inductive in the principles underlying those theories. They are generally based on the postulated existence of variable replicators in an environment with finite resources. As the replicators are capable to increase their number exponentially, some (natural) selection inevitably occurs. However, the outcome heavily depends on the type of replicators, spontaneous development of even simple autocatalytic sets is empirically unsupported in real chemistry.
In this sense generation of complexity by evolution is still not well understood. There is strong indication that below a certain (quite high) level of algorithmic complexity entities are not able to function as Darwinian replicators. There should be a specific type of variability in the replication process in order to selection be able to work in a creative way, that is, it's not true that just any kind of variability would suffice.
This is why abiogenesis is still outside the realm of science with no "standard model" of the origin of life in sight. As we have never seen life outside Earth, there is no empirical basis for assessing the probability of spontaneous occurrence of life either. All we know is the conditional probability of life having been appeared, provided we consider this problem, and that conditional probability is exactly 1 (see anthropic principle).
So I do not quite know where you are trying to get by bringing up evolution in the present context, but it is obviously more problematic than you would imagine.
*
a thirty year period of cooling, with increasing CO2 and all other forcings remaining approximately constant would kill AGW theory stone dead
That's not true. Between 1943 and 1976 (in 33 years) global land-ocean temperature index was dropping (by 0.12°C) while atmospheric CO2 concentration has increased from about 300 ppmv to 332 ppmv.

If CO2 radiative forcing is supposed to be a logarithmic function of its concentration, this is 14.6% of the forcing for CO2 doubling. If we go with the IPCC mean estimate of 3°C for doubling, surface temperature should have increased by 0.44°C during the same period. Therefore the missing heat is 0.56°C in 33 years which indicates a cooling trend at a 1.7°C/century rate without CO2 contribution. And that with the heavily adjusted GISTEMP figures (raw temperature data as measured by thermometers show a more severe cooling in this period, in excess of 0.3°C). Effect of CH4 and other trace gases with absorption lines in thermal IR are not taken into account either.
Therefore AGW theory would have been killed stone dead a long time ago, if there were no "all other forcings remaining approximately constant" clause.
In the IPCC Fourth Assessment Report: Climate Change 2007: Working Group I: The Physical Science Basis: Glossary the following definition is seen:
Radiative forcing Radiative forcing is the change in the net, downward minus upward, irradiance (expressed in W m–2) at the tropopause due to a change in an external driver of climate change, such as, for example, a change in the concentration of carbon dioxide or the output of the Sun. Radiative forcing is computed with all tropospheric properties held fixed at their unperturbed values, and after allowing for stratospheric temperatures, if perturbed, to readjust to radiative-dynamical equilibrium. Radiative forcing is called instantaneous if no change in stratospheric temperature is accounted for. For the purposes of this report, radiative forcing is further defined as the change relative to the year 1750 and, unless otherwise noted, refers to a global and annual average value. Radiative forcing is not to be confused with cloud radiative forcing, a similar terminology for describing an unrelated measure of the impact of clouds on the irradiance at the top of the atmosphere.
The remarkable part of it is that radiative forcing is defined at the tropopause, at an ill-defined surface (because of occasional tropopause folding events) high up in the atmosphere but well below any satellite orbit, a surface where practically no measurements of IR irradiance are done (either up or down).
The only direct way to determine if CO2 induced warming effect (of a magnitude similar to the one estimated by the IPCC) is falsified by observed surface cooling between 1943 and 1976 or not is to analyze the difference of two unmeasured quantities at an unknown surface. Otherwise, as this quantity is obviously unknown, one can assume there was a negative forcing there, canceling the effect of increasing CO2 concentrations. And this is exactly what people do (by setting supposed aerosol effects to a suitable value, neither supported nor contradicted by measurements).
That's what I mean by the theory being melleable enough to resist falsification attempts. Not because it is true, but because it is flexible (not good for a theory that is supposed to be scientific). - Keep those PJs on: a La Niña cannot erase decades of warming
Chad at 07:14 AM on 11 November, 2010
Sphaerica at 04:33 AM on 10 November, 2010
I also believe that I've read that the conversion factor is roughly 1.2, so +0.14C/decade troposphere equates to a surface change of +0.168C (pretty close to NASA GISS at +0.166C).
The factor 1.2 is the ratio of the global TLT trend/surface trend (~30 years). It can't be used to scale surface anomalies to TLT anomalies and vise versa.
Sphaerica at 04:59 AM on 10 November, 2010
Perhaps the difference lies in what the AMSU near surface data actually represents. I'm not well informed on that particular detail.
The near surface layer gets a lot of interference from water vapor, precipitation and ice on land and in the clouds. It's really not the best choice for temperature sounding.
Albatross at 05:18 AM on 10 November, 2010
The RSS page has a nice figure showing how the weighting works for different channels,I am not aware of such a figure for UAH.
Try to dig up any of the papers by Spencer and Christy. They show the weighting functions.
Sphaerica at 07:59 AM on 10 November, 2010
My factor of 1.54 (or 1.55) is used to convert the LT temp into a corresponding surface temp, e.g. Ts = (1.54 * Tlt) - 134.16 for 30 day smoothing, and it does so with a fairly high correlation.
Your high R2 values may be an artifact of the smoothing process. - Do critics of the hockey stick realise what they're arguing for?
protestant at 06:14 AM on 24 October, 2010
doug, but they explain only a fraction of the spikes. The rest remains unexplained and let me tell you we have no idea what caused them. And until we know we cannot tell we know the forcings of today, or even if climate actually needs a forcing to change. Anyway what we know is the temperatures always fell when CO2 was high and still rising for centuries....
The base tenet for CAGW is that no change occurs if no external forcing is presented. CAGW doesnt take into account the internal unforced variability in cloud cover, which may very well have caused the MWP, LIA and a part of the Modern maximum. Many CAGW-trumpetists claim strong MWP means a more sensitive climate which is simply untrue (as some true skeptics like Judith Curry argue, you REALLY should look at her blog and read the posts&discussions about climate models and sensitivity etc. She takes the uncertainities much better in to account than to the specific results overconfident SkS).
If (and propably) it is caused by internal variability, then negative feedback to radiative forcing actually fits in the explanation. We already have evidence on 60 year cycles like PDO and AMO after all, which are caused by winds, which are caused by pressure changes in condensation (cloud formation, models ignore this). No reason not to believe that there are longer cycles aswell (as again, MWP points out).
We also have the empirical evidence (Spencer 2007) that more water wapor means more tropospheric clouds (cooling effect) and less stratospheric ice clouds (warming effect). We also have evidence presented by Spencer 2008 and 2010 that longer scale sensitivity analysis leads to a noisy, biased result. - The 2nd law of thermodynamics and the greenhouse effect
LukeW at 09:52 AM on 23 October, 2010
Sceptics have been arguing this one for a while. Surely it's about net radiation. Does a photon know which way it's going?
And you can take a pyrgeometer (longwave radiometer) - into the backyard – point upwards on a cloudless night and measure the downward radiation with a pyrgeometer. So what's the back radiation doing?
In fact a net radiometer is a pair of pyranometers and pyrgeometers. http://en.wikipedia.org/wiki/Net_radiometer So all those people doing energy balance mustn’t know what they’re doing according to the sceptics?
Eli Rabbet did a nice demonstration of net radiation with his alfoil light bulb. http://rabett.blogspot.com/2008_09_01_archive.html
Do radiation shields show that cooler can increase warmer?
And it's even done commercially be Osram and GE
The IRC technology used in the installation lamp (burner) contains the routing of the infrared (IR) radiation of the lamp back to the filament by means of a suitable reflecting layer mounted outside on the lamp (burner).
http://www.osram.com.au/_regional_APAC/pdf/Consumer/General_Lighting/IRC_brochure_APR_lowres.pdf
Although my sceptic debater didn't like the fact that it was a reflector. So I guess warming from brick walls doesn't count here then http://wattsupwiththat.com/2008/07/02/sydneys-weather-station-150-meters-makes-all-the-difference/
An alleged refutation experiment by some is Roy Spencer's solar box - http://www.drroyspencer.com/2010/07/first-results-from-the-box-investigating-the-effects-of-infrared-sky-radiation-on-air-temperature/ but I think the relatively small cooling actually proves the point - and note here the impact of clouds here http://www.drroyspencer.com/2010/08/help-back-radiation-has-invaded-my-backyard/
A more formal treatment of the subject at http://scienceofdoom.com/2010/10/07/amazing-things-we-find-in-textbooks-the-real-second-law-of-thermodynamics/ - Do critics of the hockey stick realise what they're arguing for?
protestant at 21:23 PM on 22 October, 2010
#80 @ Ned:
Provide us evidence, that clouds are only a feedback. Please, explain an oscillating climate with positive feedbacks with TSI and CO2 as driving components. How can temperatures fall on any occasion? Only if TSI dominates over CO2? How is this possible on either scenarios, either positive or negative feedbacks?
The problem with positive feedbacks is that it would lead in to unending loop of warming. Since CO2 concentration in the atmosphere used to be controlled by sea surface temperatures. If CO2 is also driving the temperatures it would definitely need a forcing on a larger scale to turn it into cooling.
The problem with negative feedbacks would be the overall variation, since they would also compensate any warming effect but also compensate any cooling effect.
And here comes my thought: the feedbacks on sun variations are actually positive, since the sun has an ability to control the coulds so that more TSI will be let in. This theory is also being tested on the CLOUD project in CERN. But feedbacks to any radiative forcing would be negative, while increasing humidity thus increasing clouds.
Unfortunately we dont have the data to prove either case from the history. We just dont. Therefore we cant understan the present either. Only thing we have, is a strong historic correlation between cosmic rays and tropical monsoon, glacier retreat and temperatures. This suggest, there very well might be an effect, thus the feedbacks being "measured" from the radiative budget are being biased being positive when actually the change is natural while negative feedback is occuring (R. Spencers cause vs effect problem). - Uncertain Times at the Royal Society?
johnd at 09:17 AM on 5 October, 2010
scaddenp at 11:02 AM, with regards to wind, your scenario assumes that the water vapour continues to be carried along by the wind at the surface.
Consider instead the behavior of the wind in 3 dimensions where once it has absorbed the energy via the evaporation process it begins rising to be replaced by cooler drier air that continues the evaporation process.
In your scenario, there would not be any such things as storms.
With regards to clouds as a forcing, Roy Spencer in his latest paper proposes exactly that.
He asserts that clouds act as a radiative forcing generated internal to the climate system, the problem having been the difficulty in identifying and separating such internally generated forcing from what he considers as a mixture of forcings and feedback.
You ask the question, "How can clouds be a forcing?"
I think to understand where Spencer is coming from, one has to be able to put aside any preconceived ideas that could cause one to ask that question, something Spencer thinks most people find difficult so deeply entrenched the conventional view is, as are most conventions. - The contradictory nature of global warming skepticism
Eric (skeptic) at 10:33 AM on 13 September, 2010
archiesteel (#89), sensitivity is the largest area of uncertainty, not the smallest. Temperature accelerates and decelerates in time scales of multiple years, decades and centuries. To assume a constant sensitivity and assign a linear temperature increase to a linear CO2 increase is difficult at any of those time scales although decade averages (2000's > 1990's > 1980's) works at the moment (http://www.drroyspencer.com/wp-content/uploads/UAH_LT_1979_thru_Aug_101.gif)
muoncounter (#90) I have seen proxies for meridional versus zonal jet, so it would be interesting if someone has tried to correlate that to either geomagnetic changes or GCR changes (I realize those are different) or UV changes since I believe there are proxies for that as well.
Marcus (#93), not a linear trend but a poorly fitted linear model. So poorly fitted it is quite obvious when placed side by side like barry did (#32). When the model has sensitivity changes over the course of years and decades, those need to be explained. A linear fit to CO2 would have a much lower slope and is pretty much linear from the physics (back radiation increases). The extra slope alleged to be WV feedback is produced by highly nonlinear processes and cannot be extrapolated (i.e. weather changes as the world warms). The "clouds" themselves (papers linked from #90) are a highly nonlinear dependency and in light of other terrestrial influences the correlation disappears over recent decades. - Increasing CO2 has little to no effect
muoncounter at 01:16 AM on 15 August, 2010
That good friend of AGW, Dr. Roy Spencer, has empirical evidence for the greenhouse effect.
"Particularly difficult to grasp is the concept of adding a greenhouse gas to a COLD atmosphere, and that causing a temperature increase at the surface of the Earth, which is already WARM. This, of course, is what is expected to happen from adding more carbon dioixde to the atmosphere: “global warming”. ...
This [Spencer's experiment] shows that the addition of an IR absorber/emitter, even at a cold temperature (the middle level clouds were probably somewhere around 30 deg. F), causes a warm object (the thermopile [in his IR thermometer]) to warm even more! This is the effect that some people claim is impossible. - Estimating climate sensitivity from 3 million years ago
chris at 10:37 AM on 13 May, 2010
Berényi Péter at 07:22 AM on 13 May, 2010
Although the moderator doesn't like Peter Berenyi's post here, I would have thought it was appropriate. After all the thread is about Earth climate sensitivity and that's what Peter's post is about. So in the assumption that posts about climate sensitivity are O.K. (as opposed to digressions into "waste heat"!), I'm going to respond to Peter.
A problem with your post (Peter) is that the conclusion ("Therefore we should look for some explanation...") is built on a set of premises some of which are unlikely to be justified:
(i) It's worth stating from the outset that Spencer and Braswell don't conclude anything about the Earth climate sensitivity from their paper in press that you refer to, and in fact state explicitly that their analysis doesn't necessarily have any bearing on Earth climate sensitivity as commonly regarded (the change in Earth surface temperature at equilibrium in response to radiative forcing equivalent to a doubling of atmospheric [CO2]; see bottom of post [***]). Nowhere in their paper do they suggest that the climate sensitivity is 0.5 oC (they don't conclude a climate sensitivity at all). I think you may have fallen for blogosphere over-interpretation, whereby someone pretends on his blog that a paper means something that it doesn't actually mean!
So your major conclusion ("Therefore we should look for some explanation...") is invalid (non-sequitur).
(ii) It’s also worth having a look at what Spencer and Braswell have actually done. One can usually get a good idea by looking at the abstract; it's reproduced at the bottom of this post [*****].
A previous analysis (Forster and Gregory, 2006) has made a much more substantial and quantitative analysis of this subject with a good discussion of the problems, and is rather more understandable than Spencer and Braswell. The aim is to make the most direct measure of feedback by direct analysis of the combined long wave IR emitted from the earth surface (and shortwave IR reflected by the atmosphere) in response to changes (fluctuations) in the measured sea surface temperature. If the temperature rises, the change in emitted IR (measured at the top of the atmosphere by satellites; TOA) should be equal to the “blackbody” radiation determined using the Stefan-Boltzmann relationship in a system with no very fast feedbacks. This is around 3.3 W.m-2.K-1. In other words just as the Earth should warm by around 1.1 oC per doubling of [CO2] with a climate system with zero feedbacks, so an Earth temperature rise of around 1 oC should result in an enhanced IR emission of 3.7 W.m-2 as the climate system “tries” to recover radiative equilibrium. If there is a very fast positive feedback the change in emitted IR will be less than this (because the positive feedback acts to "trap" some of the LWIR escaping to space). If there is a very fast negative feedback, then the increase in TOA IR will be less than this. Forster and Gregory found that the change in TOA IR is 2.3 +/- 1.4 W.m-2.K-1, (i.e. positive feedback since the change in TOA emission is less than the blackbody value), consistent with a (fast) climate sensitivity response of 1.0 – 4.1 oC per doubling of [CO2]. i.e. unfortunately poorly constrained.
(iii) Spencer and Braswell use a variation of this in which they compare monthly averages of sea surface temperatures with monthly averaged satellite TOA measures and make regressions of the data to pull out a TOA radiative response to temperature changes. At this point their analysis becomes somewhat obscure (to me anyhow), and they compare the patterns of their regressions with model data and identify “striations” and “spiral patterns”. Their apparent change in TOA emission is 6 W.m-2.K-1. However (see [***] below), they conclude that this doesn’t necessarily relate to a climate sensitivity.
(iv) There is an inherent problem with the claim of a negative fast feedback (Spencer claims this on his blog even if he doesn’t in the paper) and this relates to the fact that the fast feedback is bound to involve water vapour. There is no question that the atmosphere responds to warming with an increase in absolute humidity (see papers on this here ). So there really has to be a positive feedback to the warming from enhanced [CO2] with respect to water vapour. Cloud changes could provide a fast feedback (and presumably that is where Spencer and Lindzen – although the latter’s analysis was incorrect – would source their putative negative feedback). However Forster and Gregory conclude (with poor certainty) that the cloud response was neutral over the time of their measurements. The only other direct analysis of cloud feedback concludes that the cloud feedback is positive (over the NE Pacific anyhow!)
(v) Finally, the temporal evolution of warming since the middle-late 19th century rather precludes negative feedbacks (clouds or otherwise) on the timescales relevant to climate sensitivity. Since we’ve had around 0.9 oC of warming during this period in response to enhanced [CO2] (290 ppm – 388 ppm) which should give around 0.4 oC of warming at equilibrium with a climate with zero feedbacks (let alone negative feedbacks) , significant negative feedbacks seem very unlikely (after all where have they been??), particularly as the solar contribution to this temperature rise is likely no more than 0.1 oC, and that some of the enhanced greenhouse warming has been offset by anthropogenic aerosols . Of course analyzing this properly requires a proper analysis! (try e.g. here, or here
-------------------------------------------------
[***]e.g. Spencer and Braswell conclude:
"Although these feedback parameter estimates are all similar in magnitude, even if they do represent feedback operating on intraseasonal to interannual time scales it is not obvious how they relate to long-term climate sensitivity."
and
"Since feedback is traditionally referenced to surface temperature, extra caution must therefore be taken in the physical interpretation of any regression relationships that TOA radiative fluxes have to surface temperature variations."
[*****] abstract: “The impact of time-varying radiative forcing on the diagnosis of radiative feedback from satellite observations of the Earth is explored. Phase space plots of variations in global average temperature versus radiative flux reveal linear striations and spiral patterns in both satellite measurements and in output from coupled climate models. A simple forcing-feedback model is used to demonstrate that the linear striations represent radiative feedback upon non-radiatively forced temperature variations, while the spiral patterns are the result of time-varying radiative forcing generated internal to the climate system. Only in the idealized special case of instantaneous and then constant radiative forcing -- a situation that probably never occurs either naturally or anthropogenically – can feedback be observed in the presence of unknown radiative forcing. This is true whether the unknown radiative forcing is generated internal or external to the climate system. In the general case, a mixture of both unknown radiative and non-radiative forcings can be expected, and the challenge for feedback diagnosis is to extract the signal of feedback upon non-radiatively forced temperature change in the presence of the noise generated by unknown time-varying radiative forcing. These results underscore the need for more accurate methods of diagnosing feedback from satellite data, and for quantitatively relating those feedbacks to long-term climate sensitivity.” - Estimating climate sensitivity from 3 million years ago
Berényi Péter at 07:22 AM on 13 May, 2010
#47 Riccardo at 17:37 PM on 11 May, 2010
there's no formal definition of slow or fast feedbacks, they must be considered relative to the time scale analyzed
That's not an answer. It always bothers me that all kinds of feedback loops are discussed all the time without assigning proper time constants to them.
For example atmospheric water feedback (including both vapor and clouds) has to be pretty fast. Residence time of water in the troposphere is about 9 days. Even in the lower stratosphere it is a month at most.
It means it should respond to any changes in SST (Sea Surface Temperature) on this timescale. That is, if the water cycle is supposed to amplify CO2 forcing threefold as claimed, we should be able to detect the effect even in short records (several years), we do not need many decades of data for this particular purpose.
This is exactly what Roy Spencer is doing recently. His upcoming paper in the Journal of Geophysical Research will be an interesting read.
Spencer, R. W., and W. D. Braswell (2010),
On the Diagnosis of Radiative Feedback in the Presence of Unknown Radiative Forcing,
J. Geophys. Res., doi:10.1029/2009JD013371, in press. (accepted 12 April 2010)
He does not address water feedback directly, but claims to have found a strong short term (~1 month) negative feedback based on 7-9 years of NASA CERES radiation budget data. For detecting fast feedback loops that much data should be more than sufficient.
On the other hand, it is hard to imagine that there could be a strong short term feedback in the climate system other than atmospheric water. At least no one has found one so far.
Anyway, if short term (up to a month or so) feedback is negative, all feedbacks operating on longer time scales (years, decades, centuries, millennia) can only take this controlled signal as input.
It means that any long term positive feedback loop that would bring temperature anomaly up to 4-5°C for CO2 doubling as claimed by Pagani should supply a gain close to 10 (Dr. Spencer has found a 0.5°C short term equilibrium value for CO2 doubling, as opposed to the 3°C IPCC "consensus" figure).
With an f value of ~0.9 the climate system would be dangerously close to a runaway feedback (f > 1). In this case any number of slight structural changes over the ages could push it over the limit. As it has never happened in billions of years, there can be no such a strong positive feedback whatsoever on any timescale.
Therefore we should look for some explanation of past excursions of climate other than carbon dioxide "forcing" amplified by multiple positive feedbacks of different origins operating on all timescales. - Common graphical tricks and the Medieval Warm Period
alphaomega at 00:01 AM on 2 May, 2010
SNRatio wrote 30 April
"With ca 0.15 degC warming/decade, it will just take a few decades for us to leave MWP territory altogether."
Dr Jones admitted in a recent BBC interview that there has been a slight cooling since 2002 and statically not significant warming since 1995 (I seem to recall). So we are on a current temperature downturn and the sun is still quiet. Is it actually possible that we might return to Maunder minimum terrritory instead? As an interested retired businessman I read both sides of the arguments and frankly I do not think that AGW supporters or sceptics really know what will happen next to global temperatures. I must admit I tend to lean towards the views held by such individuals as Dr Roy Spencer and Professor Lindzen that there may be a week warming signal caused by CO2 but natural variations in climate have the ability to overpower such a signal. For those believing that CO2 has this strong influence on global temperatures it is worth while reading the recent interview with Dr. Fred Goldbereg in People's Daily. http://english.people.com.cn/90001/90777/90853/6959757.html
Frankly there seems to be a long way to go before the climate science community know enough to exhort us to pull up the wallet and deliver billions of dollars to "saving the World". Just think of the AGW understanding of the behaviour of clouds and the lack of modelling of this behaviour in current climate models. - Could CFCs be causing global warming?
Riccardo at 09:35 AM on 5 January, 2010
Doug Cannon,
the water vapour cause/effect relation is not with CO2 but with temperature and is well established from both basic physics and observations in the atmosphere. The magnitude of the effects is "just" radiation physics, not much uncertainty on this.
On the contrary, clouds are still a weak point both for basic physics and observations. And this was the topic of Spencer talk at the AGU meeting. What i found most interesting is the (tentative) use of correlation to separate the "internal radiative forcing" (in Spencer words) from the feedback; but then it's necesessary to discriminate between the different types of clouds which has not been done.
Anyway, good science and new ideas from anyone are always welcome. - Could CFCs be causing global warming?
Doug Cannon at 04:59 AM on 5 January, 2010
I agree with the concept of looking to the physics of CFC radiation forcing and that concept certainly supports the idea that Lu's conclusion is at least premature if not totally wrong.
However, we also have to realize that the physics of CO2 radiation forcing doesn't support the results in the IPCC's models either. The majority of the forcing is due to a presumed, but unproven, amplification from water vapor/clouds.
It seems the issue of these secondary effects of CO2 lie at the heart of IPCC model credibility. Other than Spencer's latest, I don't see recent evidence of anyone really getting to the meat of this issue. - How do we know CO2 is causing warming?
Henry Pool at 06:09 AM on 4 November, 2009
Quote from the Palle 2008 report:
Earthshine and FD analyses show contemporaneous and
climatologically significant increases in the Earth's reflectance from the out-set of our earthshine measurements beginning in late 1998 roughly until mid-2000. After that and to-date, all three show a roughly constant terrestrial
albedo, except for the FD data in the most recent years.
Also look up:
http://www.bbso.njit.edu/Research/EarthShine/
Dr.Spencer had a guest post about CERES satellites showing the same
looks like earth's albedo is still growing - it is consistent with my theory that CO2 must also cause cooling as it behaves similar to water vapor. I leave it to the clever scientists to actually devise the testing method to determine the nett effect of the cooling and warming of CO2. - How we know global warming is still happening
shawnhet at 07:42 AM on 16 October, 2009
Philippe, if the temperature dew point spread is unchanged and air cools the same amount (in degrees C) from a warmer maximum, then it will condense more water based on the Clausius-Clapeyron relationship(which is the basis of the assumption of constant RH). More water condensing should lead to more cloud IMO.
This idea is not in contradiction with the other papers I have posted IMO, for the simple reason that it is hightly likely that other things than the **feedback** process I outline above influence cloudiness(on regional and global scales). This is really no different from allowing that we can have a period of cooler(or falt temperature) years, even while ever stronger CO2 feedback is (supposed to be) heating the climate. Something besides the feedback I have mentioned, may be forcing the clouds and, hence, obscuring the feedback signal.
As for substantiation, I don't think it is at all difficult to find people supporting the idea that cloud feedback is negative. ROy Spencer is one prominent example. I suppose I can find a specific paper. IAC, RSVP quoted a paper above(which I haven't read yet) and I have just been laying out what I presume to be the theoretical underpinnings of their conclusion(I haven't read the paper yet).
Cheers, :) - Climate time lag
Robbo the Yobbo at 17:41 PM on 27 July, 2009
Before Chris complains about Quadrant and Lindzen - compare it with the Trenberth and Fasula (2009) study above. Increased upward IR flux balancing CO2 warming.
'Instead the main warming from an energy budget standpoint comes from increases in absorbed solar radiation that stem directly from the decreasing cloud amounts. These findings underscore the need to ascertain the credibility of the model changes, especially insofar as changes in clouds are concerned.'
This is reinforced by a study in last weeks Science by Clement et al(copy available at http://www.drroyspencer.com/Clement-et-al-cloud-feedback-Science-2009.pdf) - note that the paper is the link - although Spencer. as usual, is worth reading on this.
Clement et al speculate that the decreasing is a positive feedback but the periods look much more like good ol' decadal SST. Increasing cloud cover since circa 2000 is a bit of a bummer for the cloud positive feedback theory - but icreasing temperature and water vapour and decreasing cloud cover was always a bit of a stretch.
It could simply be a 'chaotic dynamic' response - a climate system tuned to a 50 year cycle. But one has to wonder about a connection to the 22 year solar cycle. - Climate time lag
Robbo the Yobbo at 09:47 AM on 16 July, 2009
'What you said suggested that the climate was selectively reacting to different radiative forcings. AFAIK, there is nothing in the scientific litterature that could support that. A radiative forcing is a radiative forcing. Otherwise pointers would be appreciated.'
What I said was:
'The point is that 0.08 degrees per decade (and declining sensitivity to greenhouse gases) is not sufficient to warrant restricting the economic aspirations of billions of people.'
I am sure what I said implies that the climate response to a quanta of increase in greenhouse gases declines exponentially as gas concentrations increase. If we add x amount of greenhouse gases to the atmosphere there is y response. If we then add another x quanta - the response is less than y. Nothing magical about it.
I very patiently explained the very basic atmospheric physics and suggested you look it up on Wikepedia. What is your problem?
The EPA report is worth reading. I assume you haven't read it?
I referred the the UAH temperature graph available on Roy Spencers website. It is also available on a NASA website.
I have just had a look the Spencer CO2 blog. My first thought was - really 300 ppmv CO2 is background for an interglacial - but 380 ppmv is probably anthropogenic. I don't think Spencer claims to be convinced otherwise. Dr Roy Spencer has always been measured and rasonable.
'Roy W. Spencer received his Ph.D. in meteorology at the University of Wisconsin-Madison in 1981. Before becoming a Principal Research Scientist at the University of Alabama in Huntsville in 2001, he was a Senior Scientist for Climate Studies at NASA’s Marshall Space Flight Center, where he and Dr. John Christy received NASA’s Exceptional Scientific Achievement Medal for their global temperature monitoring work with satellites. Dr. Spencer’s work with NASA continues as the U.S. Science Team leader for the Advanced Microwave Scanning Radiometer flying on NASA’s Aqua satellite.'
The freezing point of carbon dioxide is -57 degrees centigrade. The lowest temperature ever recorded was -89.2 at Vostok in 1983. CO2 snow seems broadly feasible - although I am not sure that I would claim any climate implications - other than it is bloody cold in Antarctica.
Riccardo assumes that autocorrelation should be minimal - in fact it is the multi decadal signal in the data that is important, i.e. we are looking for the signal in the variation and not a period of approximately linear change. He assumes that the start and end points are arbitrary whereas they correspond to phase shifts in global climate as identified in the Swanson paper and as is evident in climate records. That is transitions in the mid 1940's, the mid 1970's and following 1998. He also assumes that variability is random noise whereas in fact it is temperature response to clouds, ENSO, volcanos etc. So in fact variation is meaningful and precision is limited only by the errors of measurement.
1998 is far from cherry picking - it was the end of one climate state and the beginnning of another. Very important. Swansons explanation is that the 1998 El Nino was so big it flipped climate into a new phase. I think clouds may be the driver - but feeding into a dynamic and resonant ocean and atmosphere.
"But to be rabbiting on, at such length, about these minor matters, while the great big CO2 elephant in the room keeps trumpeting for attention, is a sign of the same old denialism that is based on an unshakeable ideology that either (or both), humans can't affect a god-given home; or unfettered capitalism based on an ever increasing dependence on burning fossil fuels is the only way to conduct human affairs"
Does Thumb's post apply to the insistance that denialists are Christian and capitalists?
I was trying to be relaxed and amusing on Riccardo's post. Perhaps I should have entered into a more serious statistical discussion. Nothing you are saying has any scientific content at all. - Climate time lag
Robbo the Yobbo at 07:29 AM on 16 July, 2009
'What you said suggested that the climate was selectively reacting to different radiative forcings. AFAIK, there is nothing in the scientific litterature that could support that. A radiative forcing is a radiative forcing. Otherwise pointers would be appreciated.'
What I said was:
'The point is that 0.08 degrees per decade (and declining sensitivity to greenhouse gases) is not sufficient to warrant restricting the economic aspirations of billions of people.'
I am sure what I said implies that the climate response to a quanta of increase in greenhouse gases declines exponentially as gas concentrations increase. If we add x amount of greenhouse gases to the atmosphere there is y response. If we then add another x quanta - the response is less than y. Nothing magical about it.
I very patiently explained the very basic atmospheric physics and suggested you look it up on Wikepedia. What is your problem?
The EPA report is worth reading. I assume you haven't read it?
I referred the the UAH temperature graph available on Roy Spencers website. It is also available on a NASA website.
I have just had a look the Spencer CO2 blog. My first thought was - really 300 ppmv CO2 is background for an interglacial - but 380 ppmv is probably anthropogenic. I don't think Spencer claims to be convinced otherwise. Dr Roy Spencer has always been measured and rasonable.
'Roy W. Spencer received his Ph.D. in meteorology at the University of Wisconsin-Madison in 1981. Before becoming a Principal Research Scientist at the University of Alabama in Huntsville in 2001, he was a Senior Scientist for Climate Studies at NASA’s Marshall Space Flight Center, where he and Dr. John Christy received NASA’s Exceptional Scientific Achievement Medal for their global temperature monitoring work with satellites. Dr. Spencer’s work with NASA continues as the U.S. Science Team leader for the Advanced Microwave Scanning Radiometer flying on NASA’s Aqua satellite.'
The freezing point of carbon dioxide is -57 degrees centigrade. The lowest temperature ever recorded was -89.2 at Vostok in 1983. CO2 snow seems broadly feasible - although I am not sure that I would claim any climate implications - other than it is bloody cold in Antarctica.
Riccardo assumes that autocorrelation should be minimal - in fact it is the multi decadal signal in the data that is important, i.e. we are looking for the signal in the variation and not a period of approximately linear change. He assumes that the start and end points are arbitrary whereas they correspond to phase shifts in global climate as identified in the Swanson paper and as is evident in climate records. That is transitions in the mid 1940's, the mid 1970's and following 1998. He also assumes that variability is random noise whereas in fact it is temperature response to clouds, ENSO, volcanos etc. So in fact variation is meaningful and precision is limited only by the errors of measurement.
1998 is far from cherry picking - it was the end of one climate state and the beginnning of another. Very important. Swansons explanation is that the 1998 El Nino was so big it flipped climate into a new phase. I think clouds may be the driver - but feeding into a dynamic and resonant ocean and atmosphere.
"But to be rabbiting on, at such length, about these minor matters, while the great big CO2 elephant in the room keeps trumpeting for attention, is a sign of the same old denialism that is based on an unshakeable ideology that either (or both), humans can't affect a god-given home; or unfettered capitalism based on an ever increasing dependence on burning fossil fuels is the only way to conduct human affairs"
Does Thumb's post apply to the insistance that denialists are Christian and capitalists?
I was trying to be relaxed and amusing on Riccardo's post. Perhaps I should have entered into a more serious statistical discussion. Nothing you are saying has any scientific content at all. - Climate time lag
Robbo the Yobbo at 11:01 AM on 10 July, 2009
Not trying to hide - Rob or Robert is fine - my laptop was offline and I used a work email in registering and forgot my login details. My mates call me Robbo.
The cloud reconstruction is, and I will quote Goode et el 2009, that using 'satellite cloud data and Earth reflectance models, we also show that the decadal scale changes in Earth's reflectance measured by earthshine are reliable, and caused by changes in the properties of clouds rather then any spurious signal, such as changes in the Sun-Earth-Moon geometry.’
It is not just one paper or source however – see Hatzianastassiou et al ‘Global distribution of Earth’s surface shortwave radiation budget’, the Global Energy Balance Archive, the International Satellite Cloud Climatology Project and the Baseline Surface Radiation Network. We saw an increase in surface incident shortwave radiation of 3 to 4 W/m2 between 1984 and 1998 and a decrease of 2-3 W/m2 between 1999 and 2008. These fluxes are climatologically significant.
As I say, clouds have been treated as a climate feedback rather than a climate forcing and this is proving to be a questionable assumption.
I have provided references. There is a link to a 42 page summary from CERN’s Jasper Kirkby. It appeared in Surveys in Geophysics 28, 335-375 (Nov 2007) – but is available on the CERN server. There are several references linked to on ScienceBits:
http://www.sciencebits.com/CosmicRaysClimate
Check out Figure 3 on the site – but of course never relying on a single source.
Google Ilya Usoskin who has a dozen relevant studies on his website. Usoskin specialises in correlating cosmogenic isotopes with global temperature reconstructions over 1150 to many thousands of years.
There is also a Hadley Centre Technical Note No 62 prepared for the 4AR.
Both the Schwartz and Spencer and Braswell papers I referred to as interesting discussions. The Spencer and Braswell paper is more relevant to changing shortwave forcing.
But this is about time lag. The Mizimi post adds another element to uncertainty in the TOA fluxes – CERES calibration – on top of cloud changes and early 20th century TSI changes – as well as other changes in Earth albedo – snow and ice, black carbon, land clearing etc. I have trouble accepting PDO data prior to WW2, let alone calculated TOA fluxes to 1880. The uncertainties are far greater than the changes being modelled.
If we add to this the more recent ocean cooling. At a very minimum – a lack of heating since 2004. Does that imply a new climate equilibrium has been reached? Hardly, climate is not and never has been in equilibrium which is the fundamental flaw in all of the climate equilibrium models. - Does ocean cooling disprove global warming?
Robbo the Yobbo at 10:52 AM on 10 July, 2009
Not trying to hide - Rob or Robert is fine - my laptop was offline and I used a work email in registering and forgot my login details. My mates call me Robbo.
The cloud reconstruction is, and I will quote Goode et el 2009, that using 'satellite cloud data and Earth reflectance models, we also show that the decadal scale changes in Earth's reflectance measured by earthshine are reliable, and caused by changes in the properties of clouds rather then any spurious signal, such as changes in the Sun-Earth-Moon geometry.’
It is not just one paper or source however – see Hatzianastassiou et al ‘Global distribution of Earth’s surface shortwave radiation budget’, the Global Energy Balance Archive, the International Satellite Cloud Climatology Project and the Baseline Surface Radiation Network. We saw an increase in surface incident shortwave radiation of 3 to 4 W/m2 between 1984 and 1998 and a decrease of 2-3 W/m2 between 1999 and 2008. These fluxes are climatologically significant.
As I say, clouds have been treated as a climate feedback rather than a climate forcing and this is proving to be a questionable assumption.
I have provided references. There is a link to a 42 page summary from CERN’s Jasper Kirkby. It appeared in Surveys in Geophysics 28, 335-375 (Nov 2007) – but is available on the CERN server. There are several references linked to on ScienceBits:
http://www.sciencebits.com/CosmicRaysClimate
Check out Figure 3 on the site – but of course never relying on a single source.
Google Ilya Usoskin who has a dozen relevant studies on his website. Usoskin specialises in correlating cosmogenic isotopes with global temperature reconstructions over 1150 to many thousands of years.
There is also a Hadley Centre Technical Note No 62 prepared for the 4AR.
Both the Schwartz and Spencer and Braswell papers I referred to as interesting discussions. The Spencer and Braswell paper is more relevant to changing shortwave forcing.
But this is about time lag. The Mizimi post adds another element to uncertainty in the TOA fluxes – CERES calibration – on top of cloud changes and early 20th century TSI changes – as well as other changes in Earth albedo – snow and ice, black carbon, land clearing etc. I have trouble accepting PDO data prior to WW2, let alone calculated TOA fluxes to 1880. The uncertainties are far greater than the changes being modelled.
If we add to this the more recent ocean cooling. At a very minimum – a lack of heating since 2004. Does that imply a new climate equilibrium has been reached? Hardly, climate is not and never has been in equilibrium which is the fundamental flaw in all of the climate equilibrium models. - Climate time lag
Robbo the Yobbo at 08:19 AM on 9 July, 2009
One of the problems is that A, contrary to the ruling assumption, is not even nearly constant resulting in an increase in surface incident shortwave radiation of 6 W/m2 between 1984 (the beginning of cloud reconstructions) and 1998 and a decline of 2 to 4 W/m2 from 1998 to 2008.
The decline in cloud cover between 1984 and 1998 seems to be equally high and low cloud - so the increase in shortwave forcing is not offsett by longwave cloud effects. The only reasonable conclusion seems to be that cloud changes contributed significantly to late century warming - and certainly of the oceans. All I can say in relation to the IPCC is - how do you like those bananas?
No - naughty - I shouldn't gloat - I could conceivably be wrong. Although it is all adding up - sea surface temperatures, ocean heat content, global surface temperature, sea levels and cloud cover.
Let me go back to the Usoskin result provided earlier. The link is between cosmogenic isotopes and global temperature reconstructions over 1150 years with the best correlation on a 10 year lag. The likely conection is between the Interplanetary Magnetic Field (IMF)/cosmic radiation/clouds. This is summarised in Jasper Kirkby "Cosmic Rays and Climate'.
The IMF is reflected in the aa-index of Earth geomagnetic activity which peaked in 2003 on an annual basis - although 11 year averages peaked in the late 1980's. In discounting the link to surface temperature rise post 1975, both you and Ilya Usoskin use the wrong metrics - solar irradiance in your case and the sunspot number for Ilya.
The 10 year lag between the IMF, clouds and, consequently, global total heat content seems to be working out pretty well.
See Spencer and Braswell - http://www.drroyspencer.com/Spencer-and-Braswell-08.pdf for the implications for TOA radiative balance for varying cloud cover. Changing cloud cover falsifies the Hanson paper referred to above.
Swhartz - http://www.ecd.bnl.gov/stevepubs/HeatCapacity.pdf - provides a discussion of surface temperature response to climate perturbation based on ocean heat capacity. An interesting discussion that finds a relaxation period of 5 years and low climate sensitivity to CO2. - It's the sun
Patrick 027 at 11:34 AM on 29 May, 2009
Dan - I did notice the numbers had been adjusted, I just used the older numbers that are nearly the same to illustrate my points. I didn't mean to cause confusion.
Surface LW emissivity - I had inferred a value of about 0.96 (or maybe 0.95) from another source (Hartmann, "Global Physical Climatology", 1994, p.28) - specifically, this source states a surface emission of about 376.2 W/m2, which, if the temperature is 288 K (at which, blackbody radiation ~= 390.1 W/m2 (1 place beyond significant figures; I am using sigma = 5.67e-8)), implies a LW emissivity of 0.964; - on the other hand, the global and temporal variation of surface temperature might boost the global average surface emission so that it would correspond to a temperature 1 K higher than the actual global average (because radiation varies with the fourth power of temperature, so the areas with T>average T add more to the global average emission than the areas with T
Yes, the 390 W/m2 and the 396 W/m2 are too high but they are okay for an approximation.
(PS when dealing with totalities - the global average surface temperature, the radiative and convective energy fluxes, the albedo, etc, - some error is tolerable even if that error is greater in absolute magnitude than changes that may be studied. How so? Well, whether or not the surface has a LW emissivity of 0.95, 0.96, 0.98, or 1.00, , the change in radiative flux due to an increase in surface temperature will still be about the same. Whether the average absorbed solar flux is 235 or 240 W/m2, a change of 0.3 W/m2 would have about the same effect. Whether the total greenhouse radiative forcing is 140 W/m2 or 155 W/m2, a radiative forcing by CO2 and CH4, etc, of 4 W/m2 would have about the same effect on a change in temperature. Whether the global average surface temperature is actually 287 K or 289 K, it can be expected to increase about 3 +/- 1 K in response to a tropopause-level radiative forcing of 4 W/m2 if the climate sensitivity is about 0.75 +/- 0.25 K/(W/m2 tropopause).)
-----------
"Are they unaware that most absorption takes place close the emitting surface? The graphic is misleading. Still."..."The graphic shows the 356 going all the way to the clouds and from the clouds 333 all the way back to the ground. Since GHGs absorb the IR, the intensity has to decline along the way. Barrett calculates 72.9% is absorbed within 100 meters, http://www.warwickhughes.com/papers/barrett_ee05.pdf using the HITRAN database."
"I am surprised that no one had challenged this chart before. Climatologists discovered long ago that some of the absorbed IR radiation is thermalized, that is, it raises the temperature of the air. Climate models didn’t work at all until convection (heat rises) was included in the mid 60s. “…in the real world by the upward convection of heat.” Spencer Weart at http://www.aip.org/history/climate/simple.htm ."
"The chart clearly shows Surface Radiation 396 with 356 of this going clear to the clouds. It is misleading because first it’s closer to 382 than 396 and second there is no indication that some of this (I calculate 59) must get thermalized. The rest, except for the 40 that go all the way out, gets radiated back. The graphic also shows 333 coming from the clouds. This too is misleading since only a fraction of the radiation that leaves the clouds (my guess about 35) gets all the way from the clouds to the ground."
------
A.
I did address two key points before but I'll go over them again briefly:
1.
Of the emitted radiation from a layer of air or from the surface, emitted at one wavelength in one direction, the amount that reaches (specifically, is transmitted without scattering) through an optical path length decreases exponentially with increasing optical thickness of the path (which will tend to correspond to a geometric distance within a given material of given optical properties). As the derivative of an exponential function is an exponential function, setting aside scattering, the absorption per unit optical path length decreases exponentially over increasing optical path length.
When integrating over directions (solid angle) and over wavelength to find the total flux in the vertical direction per unit horizontal area, the results are qualititatively similar; HOWEVER:
a.
Per unit vertical optical path length, the optical path length for a given direction increases for directions farther from vertical. The radiation that is emitted in directions far from vertical...
---
(perfect blackbody radiation is isotropic; the intensity (flux per unit area per unit solid angle) is invariant over direction; contributions to total flux per unit area are weighted by the cosine of the angle from vertical because of the ratio of the area perpendicular to the direction to the horizontal projection of that area)
---
... decays more rapidly per unit vertical distance. The same will be true for radiation at wavelengths where there is greater optical thickness per unit vertical distance - where the opacity is greater. Thus, the transmission of some portion of the radiation emitted from a layer at height z may decay almost to zero within a short distance, while another portion may decay much less rapidly. So per unit vertical distance, even with optical properties held constant with height, if (for example) 50 % of radiation from one layer is absorbed in the first 100 m, less than 50 % of the remaining transmitted radiation may be absorbed in the nex 100 m, and so on; it is easy to imagine a situation (not that this would be the case for Earthly conditions) where 50 % is absorbed in the first 100 m and only 10 % of the remainder is absorbed in the next 100 m.
b.
Optical properties are not constant. Obviously - you probably were aware of clouds, and for that matter, surface material is generally much more opaque than the atmosphere at most wavelengths (which is why it is only necessary to consider temperature at the surface, and not through a depth of material, when figuring out surface LW emission - now, for visible light, absorption in water is distributed over a depth, but it still forces the surface temperature because the heat that goes in has to come out eventually if in a climatic equilibrium. Light absorption in vegetated areas will be distributed between the tops of the plants and the soil level, etc.)
But even within the air and aside from clouds and any other aerosols, there are compositional variations - most importantly, water vapor is much more concentrated near the surface than higher in the troposphere, and ozone is more abundant above the tropopause (I am refering to relative concentrations - relative to the density of the air).
Even without compositional variations, optical properties vary with height. There is decreasing line broadening of gas spectra with height at least within the troposphere, which increases the opacity at some wavelengths but tends to increase transmission on average over the spectrum.
2.
The diagrams you are looking at do not show all the individual fluxes between different layers of air. They show the LW fluxes out of the atmosphere to the surface and to space, and the LW fluxes from the surface to the atmosphere and to space. They also show only the total SW (solar) absorption by the atmosphere and by the surface, and not how that absorption is distributed within the atmosphere and the over the surface or within surface material.
For LW fluxes in particular:
The source of the flux out of the atmosphere is distributed in the same way as would the absorption of the same mix of radiative fluxes over direction and wavelength in the exact opposite directions. In other words, the source of radiation that reaches some location is distributed in a manner matching visibility from that location, weighted by temperature-dependent blackbody emission if the radiation is entirely from emission and not scattering.
The flux shown from the atmosphere to the surface is the flux that reaches the surface from various levels of air, and does not include the emissions from the air that are absorbed by the air. The same is true for the atmospheric radiation to space. The absorbtion of the flux from the surface by the atmosphere is distributed over the the atmosphere; the diagram is not intended to show that distribution, but only the total flux to all levels of atmosphere from the surface.
I have explained in more detail how radiative fluxes work in some other comments above and in some referenced links. Basically, there are generally contributions to the radiative flux in all directions; a net radiative flux requires an imbalance between fluxes in opposite directions. For thermal radiation - emitted as a function of temperature - this requires that there is some temperature variation that is visible from the location at which the flux is being considered; the opacity must be low enough that the temperature variation is not hidden from view, but the layers of different temperatures have to have some opacity, and specifically some emissivity, in order to affect the flux by their emissions. However opaque or transparent the atmosphere is, the surface has some emissivity and space can be approximated as a blackbody near or at absolute zero. When, where, and at wavelengths where the atmosphere is transparent, the surface and space can 'see each other' - the surface emits radiation directly to space; when the atmosphere is mostly transparent, it partly blocks the radiation from the surface to space - if opacity comes from scattering (for LW wavelengths, this scattering is a minor issue for Earthly conditions), some of the radiation is scattered but still reaches space; the radiation that is blocks is reflected back to the surface, and from space, the Earth appears colder because a fraction of what is seen is a reflection of the dark of space itself. Assuming the average temperature of the atmosphere is colder than the surface temperature, if the opacity comes from absorption, then to the extent the atmosphere is not transparent, what the surface 'sees' - what it recieves in radiation - has been partly replaced by some radiation from the atmosphere (as opposed to the dark of space), while for what can be seen from space, the same fraction of the surface radiation has been replaced by atmospheric radiation, which is less than the flux it replaces since it is colder. But if the atmospheric opacity is small, than individual layers do not significantly block each other's radiation, so the atmosphere emits about the same radiation upward as well as downward, no matter how temperature varies with height. Because temperature decreases with height over the troposphere and the upper layers where it is warmer again are much thinner, the tendency is that as atmospheric opacity from absorption increases, the atmosphere appears colder from above than from below - as it blocks even more radiation from the surface to space and blocks the dark of space from the surface, the radiation to the surface becomes greater than the radiation to space. This kind of analysis can be quantified and extended to fluxes between individual layers of atmosphere - and this has been done (but not in Kiehl and Trenberth in particular).
------------------
Clarification:
About the thermalization of radiation -
Generally, almost all radiation that is absorbed is thermalized. As some gases absorb radiation, they gain energy, which is then distributed by molecular collisions to the air as a whole. When some gases emit radiation, they lose energy, but the energy loss is redistributed by molecular collisions to the air as a whole. The bulk of the atmosphere is dense and warm enough that molecular collisions are sufficiently more frequent than photon absorptions and emissions, so that the various gaseous substances, despite their varying optical properties, are approximately at the same temperature (hence, the air is generally approximately in local thermodynamic equilibrium). When radiant energy is emitted from or absorbed by a unit mass of air, it affects the temperature according to the specific heat of the air as whole.
The backradiation from the air is not simply radiation that is 'returned' to the surface; it is emitted by the air as a function of optical properties and temperature.
People often use unclear language when describing these processes.
------------------
http://www.aip.org/history/climate/simple.htm
I'm glad to see you've looked at this website.
Convection is important and is taken into account in the current understanding of climate and how the greenhouse effect works. I explained this some number of comments ago when I explained the importance of radiative forcing at the tropopause level to surface temperature. - It's the sun
Dan Pangburn at 08:52 AM on 29 May, 2009
Patrick 027 447
Apparently you did not notice that nearly all of the numbers on the revised K&T chart are different from the numbers on their 1997 chart.
For those who did not pursue the link regarding the K&T update, these are the comments that I made there.
“Are they unaware that most absorption takes place close the emitting surface? The graphic is misleading. Still.”
“The graphic shows the 356 going all the way to the clouds and from the clouds 333 all the way back to the ground. Since GHGs absorb the IR, the intensity has to decline along the way. Barrett calculates 72.9% is absorbed within 100 meters, http://www.warwickhughes.com/papers/barrett_ee05.pdf using the HITRAN database.”
I am surprised that no one had challenged this chart before. Climatologists discovered long ago that some of the absorbed IR radiation is thermalized, that is, it raises the temperature of the air. Climate models didn’t work at all until convection (heat rises) was included in the mid 60s. “…in the real world by the upward convection of heat.” Spencer Weart at http://www.aip.org/history/climate/simple.htm .
The chart clearly shows Surface Radiation 396 with 356 of this going clear to the clouds. It is misleading because first it’s closer to 382 than 396 and second there is no indication that some of this (I calculate 59) must get thermalized. The rest, except for the 40 that go all the way out, gets radiated back. The graphic also shows 333 coming from the clouds. This too is misleading since only a fraction of the radiation that leaves the clouds (my guess about 35) gets all the way from the clouds to the ground. - Volcanoes emit more CO2 than humans
Quietman at 06:32 AM on 1 April, 2009
Pat
Re: "statistical study of the raw data for yourself"
Yes but in MY field, not in climatology. ie. I understand correletions, nobody understands climate yet.
Re: "You did post a source about ENSO being connected to volcanos via volcanic aerosol climate forcing - noting that not all El Ninos are caused that way."
No, not "via volcanic aerosol climate forcing", an article of SIGNALING the beginning of a cycle, ie. the volcano erupts and is used as a SYMPTOM.
Re: "You've never actually posted any source that links any of that to planetary alignments. You did post a source about a planet that would be heated sufficiently by tidal deformation to be kept habitable whereas it would not otherwise be so. Tidal heating of the Earth is a fraction of geothermal heat release, most of which is slow and steady, related to conduction through the crust, and in total is puny in comparison to just the recent changes in climate radiative forcings."
If you refer to the "Thermostat article", you make the assumption of an earth with a constant rate. That constant rate was disproved by the findings in Nepal and Tibet of just how old the Himalyas are (they are MUCH more recent than thought). It was also proven false by further studies in both the Rockies and the Andes. They are much younger than thought.
In my hypothesis I make a couple of assumptions (as in any hypothesis). I assume first that Rhodes Fairbridge was correct in the "Solar Jerk" and hypothesize that this same jerk is applicable to the Earth. This explains why plate tectonics occur in "fits and spurts".
The second assumption is that the ENSO is related to the South AMerican subduction zone. Unfortunately when I read the hypothesis on the tectonic cause of ENSO I was doing research for my own curiosity and did not note the website (all I remember was it was a dot gov). I had cut and paste the hypothesis to notepad and saved it for my own reference. If I relocate the site I will post it here.
In the meantime, expect El Nino soon.
Volcano in Chile spews lava and blasts ash 12 miles into sky
But there are more signs of current activity:
Tongan Inspection Team Heads to Undersea Volcano
And more arctic seafloor recycled here:
Ash Falls on Anchorage as Volcano Keeps Spewing
The third assumption is that clouds cool and lack of clouds allow IR warming, ie. Spencers work on positive vs negetive feedback to GHGs. Sorry, I don't need math here to prove he is right, it's common sense. - Volcanoes emit more CO2 than humans
Patrick 027 at 11:45 AM on 19 January, 2009
The problems I saw in Spencer's approach:
1. he was looking at climate sensitivity based on Temperature and radiative fluxes (top of atmosphere (TOA)) over rather short time periods. This is not an equilibrium climate sensitivity at all.
(PS if a period of 5 years is sufficient, then why isn't 40 or 100 years of warming sufficient?)
2. conceivably there could be some net global cloud feedback, as well as the ice-albedo and and water vapor feedbacks and others, to forcing of climate from CO2, etc.
Over short time periods (this is part of concern 1, actually), any water vapor feedback and other feedbacks, etc., would be limited by thermal inertia of the oceans. In addition, CO2 would generally only be a feedback over longer time periods.
What is the cloud feedback to cloud forcing? 'Internal Radiative Forcing' is a feedback to some other internal effect, and will react to itself...
3. If one of the graphs could be shown in enough detail, one might judge to what extent temperature fluctuations are driving radiative fluctuations and vice-versa - obviously both happen - they must, that's the physics.
4. On that note, there can be some correlation, perhaps with some lag in time or not, between cloud radiative feedback and temperature, or temperature changes, that is not entirely due to a direct forcing of temperature by clouds OR a direct forcing of clouds by temperature.
The short term variability may involve fluctuations in cloud type, amount, and distribution, and in temperature and wind, etc, that are of a different nature than that of longer term changes.
5.
Spencer's description of how the IPCC, etc, estimate sensitivity is not descriptive enough for me to judge what it means.
-------
FROM http://www.drroyspencer.com/research-articles/satellite-and-climate-model-evidence/
"And it appears that the reason why most climate models are instead VERY sensitive is due to the illusion of a sensitive climate system that can arise when one is not careful about the physical interpretation of how clouds operate in terms of cause and effect (forcing and feedback)."
This seems to set aside any work that goes into trying to realistically model clouds based on observations of clouds and weather on smaller spatial scales (relative to global) - I think 'they' do that.
"
The allure of models is strong: they are clean, with well-defined equations and mathematical precision. Observations of the real climate system are dirty, incomplete, and prone to measurement error.
"
Well, I guess we should trust the models, then, eh Spencer? :) (I just found that particular passage to be very ironic, and not just within the context of this paper.) - It's Pacific Decadal Oscillation
Quietman at 05:36 AM on 17 November, 2008
Roy Spencer's view on how the PDO fits the equation:, a brief part of a new paper being submitted. - Volcanoes emit more CO2 than humans
Patrick 027 at 13:13 PM on 19 October, 2008
...
or
5. internal variability greater than thought
__________
About efficacy of forcings:
I haven't actually read much about that but here's what I would expect:
Consider a forcing by
Solar TSI
LW (greenhouse) forcing
volcanic stratospheric aerosols
tropospheric aerosols
surface albedo
For any given forcing - let's start with radiative forcing - there is:
1. a global average TOA (top of atmosphere) value, R-TOA.
2. a global average tropopause value, R-tp
3. a global average surface value, R-sfc.
4. Some spatial-temporal (seasonal, perhaps interannual) variation in either of R-TOA, R-tp, R-sfc, which I will simply refer to here as R-var.
5. Some climatic response which results from the effect of R and feedbacks.
-
To start with, we might assume an approximation that the climatic response in so far as global average is concerned, is similar to any R-tp or R-TOA for any forcing. Then we might look for deviations from that.
Differences:
R-TOA is the forced net change in downward minus outgoing radiation 'at' the top of the atmosphere.
R-tp is different then R-TOA; both are different from R-sfc - First:
1.
An increase in solar TSI - if the same % increase at all wavelengths - the forcing is a heating distributed (unevenly) through the atmosphere and surface. R-TOA is the sum of all of this heating; R-tp is only the heating below the tropopause and is therefore somewhat less than R-TOA; R-sfc is only surface heating and is therefore less than R-tp.
Typically changes in solar TSI are greater in UV in particular, so a larger fraction than otherwise of solar forcing goes into heating the upper atmosphere, thus decreasing R-tp even further.
2.
Greenhouse forcing is a reduced cooling to space, which is a heating of the surface and/or lower atmosphere. The cooling to space of the stratosphere and above, however, increases, while the heating of higher atmospheric layers by the surface and/or lower troposphere decreases. Thus for greenhouse forcing, R-TOA will be a little less then R-tp. Starting at minimal LW opacity, R-sfc might be greater than R-tp (?), but at least for CO2, my impression is increases from the current amount result in greater R-tp than R-sfc. Water vapor is a feedback, but applying the same concepts to water vapor, I think, at least under some conditions, R-sfc is greater than R-tp for water vapor. This is at least in part due to water vapor's increasing concentration toward the surface. Ozone concentration is also variable so greenhouse effects of ozone changes may be a bit different than the 'typical' well-mixed greenhouse gas.
The exact relationship between R-tp, R-sfc, and R-TOA for even well-mixed greenhouse gases (like CO2, CH4, N2O, CFCs) (they have some spatial and seasonal variations but not to the degree of ozone or water vapor) could vary because they have different spectrums, and temperature (and water vapor, ozone, cloud content) varies with height (and other dimensions), they may overlap with each other and other things in different ways due to the above differences, and they have different initial amounts before changes occur.
3.
a decrease (to keep the same sign of forcings for more straightforward comparison) in volcanic stratospheric aerosols - this would reduce albedo. The aerosols reflect SW (solar) radiation back up from the stratosphere, thus cooling the troposphere and surface but possibly heating the air above; and perhaps heating the stratosphere a little bit (? I think the stratosphere or some part of it actually warms up after relevant eruptions - this might be due to the nonzero absorption of solar radiation by the aerosols themselves) (some of the solar radiation is scattered downward or sideways - for a near-overhead sun (middle of day, summer midlatitude, or at low latitude), this can increase the path length before reaching the surface, thus increasing the portion absorbed in the air...) ... SO scattering of radiation is complicated (but not so much that it isn't understood), but reducing volcanic aerosols results in an R-sfc and R-tp greater than R-TOA, and I suspect R-sfc would be greater than R-tp.
4.
tropospheric aerosols
4a.
A decrease in the albedo from reduced scattering by aerosols:
R-sfc will be greater than R-tp and R-TOA as some of the reflected and scattered radiation had been absorbed by air and clouds.
4b.
An increase in the atmospheric heating by increased absorption of aerosols:
R-TOA and R-tp will be positive while R-sfc is negative.
4c. scattered radiation can be subsequently absorbed in the air; the total effect of aerosols is not simple, but again, it isn't an impossible riddle either.
5.
Decrease in albedo due to surface conditions: The change in albedo actually at the surface may have to be greater than that which results at TOA, due to clouds, but also time of day and year issues, and latitude. Anyway, reflected solar radiation has a second chance to be absorbed by the air, so the decrease in albedo because of surface conditions may result in R-sfc greater than R-tp and R-tp greater than R-TOA (but perhaps only slightly).
HOWEVER:
R-tp may be (as it is in IPCC work) defined as that which occurs after the stratosphere and above have reached thermal equilibrium with the forced heating or cooling (R-TOA - R-tp) which occurs there (PS notice this is not the same as that equilibrium which would result after the climate response including the tropsophere and surface). If R-TOA is greater than R-tp, then the stratosphere, etc, will have warmed, so R-tp will be a little higher as a result due to increased downward LW radiation (or a decrease in net upward LW radiation). If R-TOA is less than R-tp, the opposite will be true. In other words, R-tp will get closer to the original R-TOA (But I don't think it would be equal to the original R-TOA - I expect it to still be less or greater than R-TOA, whichever was the case to begin with). R-sfc might also shift in the same direction but not as much so long as there are any greenhouse agents within the troposphere.
Of course, in the full climatic response, however tropospheric heating (R-tp - R-sfc) is distributed within the troposphere, or however much it is, as an upper layer warms up, it reduces convective heat transport from below, thus the tendency is for the full effect of R-tp to propogate by convection to the surface, whatever R-sfc was. However, a larger R-tp - R-sfc and/or smaller or negative R-sfc value will tend to reduce convection from the surface - HOWEVER, after all feedbacks have occured, the radiative heating/cooling distribution may be different again. ***I think this would be less true for regionally-concentrated forcings (pockets of high aerosol concentrations, for example), because advection into and out of the area would prevent a radiative convective equilibrium on the regional scale, so perhaps this is partly why I hear of atmospheric brown clouds (dark absorbing aerosols) in particular reducing vertical motion by increasing stability.
So a global average R-tp will tend to result in some global average tropospheric and surface temperature increase. Some other effects due to the vertical distribution may change the feedbacks that occur and thus the resulting temperature changes in the surface and troposphere - but to my knowledge that is not a big effect (?).
The horizontal (and seasonal, if and when it matters (ozone)) variations could also affect the actual global average results. For example - the R-tp and R-TOA of albedo reduction from BC landing on snow/ice will likely be a little smaller than the R-sfc value (some radiation reflected from the surface can be reflected back to the surface by clouds, aerosols, and air molecules); furthermore and perhaps much more importantly, the effect is concentrated where a positive feedback is also concentrated (snow-ice albedo feedback). Thus the climate sensitivity could be expected to be larger to BC on snow/ice forcing than to some other forcings, to the extent that the forced heating is not entirely advected away from similar locations.
As far as anthropogenic well mixed greenhouse gases (WMGHG - to adopt the acronymn I saw in a paper - this includes CO2, CH4, N2O, CFCs - well, at least a couple CFCs) compare to solar radiative forcing - the geographic distribution of R-tp is going to be at least a little similar on a broad scale - the LW forcing is highest in the subtropics because of the relatively dry cloud-free air and higher lapse rates; high cloud tops in the tropics prevent greenhouse gases below them from having any direct effect on R-tp; lower tropospheric and surface temperatures in general and smaller lapse rates at higher latitudes reduce the difference in outgoing LW radiation (at least at tropopause level - and the tropopause is lower there, too) that would result from changing greenhouse gas concentrations (and the lower surface temperatures. Solar forcing will generally be greatest at low latitudes, during the day, and/or in summer, where there are fewer clouds, reflective aerosols, darker surfaces (ocean, forests), etc. For example, the dry subtropics (but unlike WMGHGs, solar forcing would not be as large over dry light-colored landscapes as it would be over dark oceans). Etc. R-tp will be higher than otherwise when there is less stratospheric ozone. There is a latitudinal and seasonal ozone variation - there tends to be more ozone at higher latitudes in winter/spring, I think - because while stratospheric ozone is produced more at low latitudes, winter stratospheric circulation brings it into high latitudes, and actually 'piles it up' there, in part (if not in whole) because the stratosphere is thicker at higher latitudes (lower tropopause)...
----
Of course anthropogentic GHG forcing is expected to result in a cooler stratosphere (observed - although stratospheric ozone depletion also has a similar effect - but each can be calculated so it should be possible to attribute portions of cooling), and greater warming at nights during days near and at the surface over land (not much diurnal cycle to begin with over oceans because of heat capacity) - (also observed, at least somewhat). Positive solar forcing that would warm the surface and troposphere would also warm the stratosphere (not observed). However, because of this, there could be effects on atmospheric circulation that are different than for GHGs, which might affect climate sensitivity (but how much and in what direction?).***
(Quietman - if you want to show a reduced climate sensitivity by way of greater total forcing, you might try looking into how solar forcing, including non-TSI or non-UV effects, affect not only the stratosphere, but also the ionosphere, and for example the E-region dynamo, and how geomagnetic effects also affec the E-region dynamo and solar-magnetospheric-ionospheric interactions, and what any resulting circulation pattern changes would be, and if and how that propogates downward. I am not saying that I expect you to be successful, but it's a thought - while I have my doubts, I think it's got a lot more potential than submarine volcanism, solar jerk, tides on sun, Spencer's PDO+ENSO work, Spencer's cloud forcing work, urban heat island dominance, or the idea that there hasn't been a recent spurt of global warming above and beyond internal variability.) - Water vapor is the most powerful greenhouse gas
Quietman at 01:08 AM on 7 October, 2008
Has Global Warming Research Misinterpreted Cloud Behavior? ScienceDaily (June 12, 2008)
["Unfortunately, so far we have been unable to figure out a way to separate cause and effect when observing natural climate variability. That's why most climate experts don't like to think in terms of causality, and instead just examine how clouds and temperature vary together.] - Spencer - Models are unreliable
Dan Pangburn at 03:20 AM on 25 September, 2008
Chris:
Your assertion “…talk a lot of nonsense…” may reveal that you simply do not understand how feedback works. The graphs in the Middlebury link are plots of data from NOAA and other credible sources. They speak for themselves and are as correct as the data sources.
Apparently you accept Scotese’s temperatures. The carbon dioxide level at that time is from GEOCARB III as published in the American Journal of Science. The graph at http://www.globalwarmingart.com/wiki/Image:Phanerozoic_Carbon_Dioxide_png shows a lot of illogical scatter in Royer’s compilation but fair agreement between 30Myr filtered Royer, Copse and GEOCARB III. I have found no rational argument as to why the atmospheric carbon dioxide level should dramatically change prior to the temperature dropping into that ice age. The assertion remains that the temperature dropped while the carbon dioxide level was several times higher than now.
The graph of CO2 and average global temperature during the Phanerozoic (all of the time that there have been complex life forms, the last 550 million or so years) at http://mysite.verizon.net/mhieb/WVFossils/Carboniferous_climate.html is as good as any. A lot of imagination is needed to see any correlation there between atmospheric carbon dioxide and average global temperature.
You say “the warming oceans release CO2 into the atmosphere resulting in further warming”. That would be a ramp up in temperature. But then the ramp up changed direction and became a ramp down. And this direction change in temperature trend happened repeatedly during the last and previous glaciations. That could not happen if there was significant net positive feedback.
For those who understand how feedback works, this temperature trend direction change proves that there is no significant net positive feedback. All that is needed to determine if there is net positive feedback is a temperature trace for a long enough time to average out cyclic variation from random noise and other factors. The temperature trace does not even need to be correct in absolute terms just reasonably accurate in relative terms time-wise. Without significant net positive feedback added atmospheric carbon dioxide does not produce significant increase in average global temperature. Even the flawed GCMs give that result. Those who think they “…know about greenhouse gases and their effects…” apparently do not recognize the significance of this observation.
While determination of the magnitude and even the sign of net feedback in climate may be difficult using climatology (Spencer at a link in 41 above and also Monckton at http://www.aps.org/units/fps/newsletters/200807/monckton.cfm have done it), it is trivial, as described above, for someone who understands feedback, to deduce from the temperature record that net positive feedback does not exist. Many climatologists apparently don't know how feedback works so they don't realize this. Unaware of their ignorance, they impose significant net positive feedback in their GCMs which causes them to predict substantial warming from carbon dioxide increase. Without significant net positive feedback, the GCMs do not predict significant Global Warming. From Monckton’s paper “The IPCC overstates temperature feedbacks to such an extent that the sum of the high-end values that it has now, for the first time, quantified would cross the instability threshold in the Bode feedback equation and induce a runaway greenhouse effect that has not occurred even in geological times despite CO2 concentrations almost 20 times today’s, and temperatures up to 7 ºC higher than today’s.”
Do you realize how many times you said in 46 that the sun started it? These were extracted from your text: “…insolation changes…”, “…primary inducer of the warming is increased solar radiation…”, “…decreased [s]olar insolation resulted in cooling…”, “…one “lowers the heater” that the Earth cools…” Solar variation is certainly a major part of it. Of the list of other possible contributors to climate change, some ignored, some subjectively parameterized; solar wind, clouds, vertical convection, cosmic rays, Milankovitch cycles, etc. and factors not yet discovered, only significant net positive feedback is readily ruled out. Influencing any of the others doesn’t look promising. Humanity needs to adapt to climate change. Warming is not a problem. If it gets too hot or wet or dry where you are at, move. There are currently places that lack permanent occupancy because they are too hot, too cold, too wet or too dry. Half of humanity may starve in the coming glaciation, however, because rice does not grow on ice.
The high rate of change of the level of atmospheric carbon dioxide today is not relevant to climate change since the level of atmospheric carbon dioxide has no significant influence on climate. Eventually, excess atmospheric carbon dioxide will dissolve in the ocean which already holds over 50 times as much as the atmosphere. Interestingly, I have read that the rate of increase of carbon dioxide in the atmosphere is about half of what is calculated based on the amount added by humanity.
In your lawyer-like advocacy and nitpicking of the scarcity of paleo data you appear to have completely missed the point of temperature trend reversals ruling out net positive feedback. I suggest that you break out of the box that you are in, adopt engineer/scientist-like objectivity and learn about feedback.
There are legitimate reasons to constrain the use of fossil fuels. As the level of atmospheric carbon dioxide continues to increase, and it will, humans may find enclosed places becoming ‘stuffy’ sooner than previously. The consumer price rise of liquid fuels as a result of ‘peak oil’ will curtail their use and stimulate alternate fuels such as algae produced biodiesel. I have been antagonistic to coal for decades and am suspicious of claims that mercury, soot and acid can be effectively removed from the exhaust. When humanity gets past their unjustified paranoia regarding nuclear power and start building breeder reactors they will have all of the energy needed for millions of years. Enough to recharge their hybrids and even synthesize liquid fuel to go beyond battery range. - Water vapor is the most powerful greenhouse gas
Dan Pangburn at 09:14 AM on 17 September, 2008
A study of satellite data on clouds and water vapor indicates that prior predictions of substantial Global Warming are wrong. The study introduces a new method to diagnose the total radiative feedback parameter. Corrected analysis will result in low climate sensitivity where the GCMs predict insignificant global warming with increased atmospheric carbon dioxide. The subject is discussed at http://www.weatherquestions.com/Roy-Spencer-on-global-warming.htm .
A completely independent analysis reveals that there is insignificant net positive feedback. This has the same effect on the climate as the finding of low climate sensitivity. Examination of the temperature data of the last and prior glaciations from NOAA as determined from Vostok ice cores reveals that temperature trends reversed direction irrespective of carbon dioxide level. This proves that there is no significant net positive feedback. Climatologists, who apparently don't know how feedback works don't realize this. Unaware of their ignorance, they impose net positive feedback in their GCMs which causes them to predict substantial warming from carbon dioxide increase. Without significant net positive feedback, the GCMs do not predict significant Global Warming.
An assessment from a third perspective also determines that there is no significant net positive feedback. It can be seen at http://www.climate-skeptic.com/2008/01/index.html - Temp record is unreliable
Mizimi at 01:29 AM on 12 August, 2008
Sorry, forgot to post the sites....Look at:
http://science.nasa.gov/headlines/y2000/ast21jul_1m.htm
http://climate.geog.udel.edu/~climate/html_pages/ghcn_T_stn.html
Note the closing comments......
"The improved temperature record will guide efforts to refine computer models of the world's climate so that the behavior of the models more closely resembles the observed behavior of the atmosphere.
Current models suffer from several shortcomings.
For example, clouds are not well represented by the models. The resolution of current models is too coarse for features as small as clouds, Spencer said. Yet clouds clearly play a crucial role in climate due to their influence on humidity, precipitation and albedo (the percentage of solar energy reflected back into space as light).
"The role of clouds is still regarded as one of the biggest uncertainties in global warming predictions," Spencer said.
The ability of plants to remove carbon dioxide from the atmosphere and the role of soils have only recently been added to the models, and scientists aren't confident yet of how the models portray these factors, Spencer said.
"While we know that vegetation takes up some of the carbon dioxide we generate from burning of fossil fuels, how that sink of carbon will change in the future is still pretty uncertain," Spencer said.
Climate models are also limited by the computing power available.
"The global models would be much better if computers were much faster," Spencer said. "Instead, a lot of approximations are made to make the models simple enough to do climate simulations over the whole globe.
"Unfortunately," Spencer continued, "we know that many of the processes that are crudely represented are quite non-linear, and so have the potential to respond in unexpected ways."
More than 100 comments found. Only the most recent 100 have been displayed.
More than 100 comments found. Only the most recent 100 have been displayed.


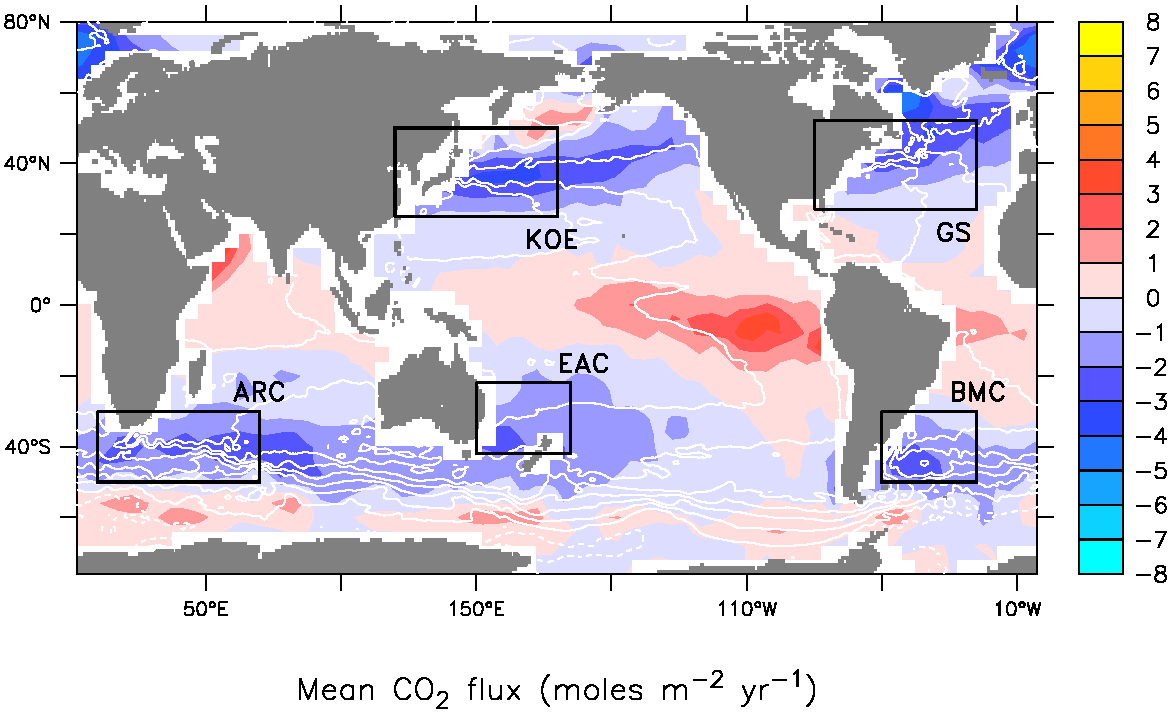
THE ESCALATOR

(free to republish)