Climate Science Glossary

Term Lookup

Enter a term in the search box to find its definition.

Settings

Use the controls in the far right panel to increase or decrease the number of terms automatically displayed (or to completely turn that feature off).

Term Lookup

Settings


All IPCC definitions taken from Climate Change 2007: The Physical Science Basis. Working Group I Contribution to the Fourth Assessment Report of the Intergovernmental Panel on Climate Change, Annex I, Glossary, pp. 941-954. Cambridge University Press.

Home Arguments Software Resources Comments The Consensus Project Translations About Support

Twitter Facebook YouTube Mastodon MeWe

RSS Posts RSS Comments Email Subscribe


Climate's changed before
It's the sun
It's not bad
There is no consensus
It's cooling
Models are unreliable
Temp record is unreliable
Animals and plants can adapt
It hasn't warmed since 1998
Antarctica is gaining ice
View All Arguments...


Username
Password
New? Register here
Forgot your password?

Latest Posts

Archives

Watts' New Paper - Analysis and Critique

Posted on 2 August 2012 by dana1981, Kevin C

 "An area and distance weighted analysis of the impacts of station exposure on the U.S. Historical Climatology Network temperatures and temperature trends"
Paper authors: A. Watts, E. Jones, S. McIntyre and E. R. Christy

In an unpublished paper, Watts et al. raise new questions about the adjustments applied to the U.S. Historical Climatology Network (USHCN) station data (which also form part of the GHCN global dataset).  Ultimately the paper concludes "that reported 1979-2008 U.S. temperature trends are spuriously doubled."  However, this conclusion is not supported by the analysis in the paper itself.  Here we offer preliminary constructive criticism, noting some issues we have identified with the paper in its current form, which we suggest the authors address prior to submittal to a journal.  As it currently stands, the issues we discuss below appear to entirely compromise the conclusions of the paper.

The Underlying Problem

In reaching the conclusion that the adjustments applied to the USHCN data spuriously double the actual trend, the authors rely on the difference between the NCDC homogenised data (adjusted to remove non-climate influences, discussed in detail below) and the raw data as calculated by Watts et al.  The conclusion therefore relies on an assumption that the NCDC adjustments are not physically warranted.  They do not demonstrate this in the paper.  They also do not demonstrate that their own ‘raw’ trends are homogeneous. 

Ultimately Watts et al. fail to account for changing time of observations, that instruments change, or that weather stations are sometimes relocated, causing them to wrongly conclude that uncorrected data are much better than data that takes all this into account. 

Changing Time of Observations

The purpose of the paper is to determine whether artificial heat sources have biased the USHCN data.  However, accounting for urban heat sources is not the only adjustment which must be made to the raw temperature data.  Accounting for the time of observations (TOB), for example, is a major adjustment which must be made to the raw data (i.e. see Schaal et al. 1977 and Karl et al. 1986). 

For example, if observations are taken and maximum-minimum thermometers reset in the early morning, near the time of minimum temperature, a particularly cold night may be double-counted, once for the preceding day and once for the current day.  Conversely, with afternoon observations, particularly hot days will be counted twice for the same reason.  Hence, maximum and minimum temperatures measured for a day ending in the afternoon tend to be warmer on average than those measured for a day ending in the early morning, with the size of the difference varying from place to place.

Unlike most countries, the United States does not have a standard observation time for most of its observing network. There has been a systematic tendency over time for American stations to shift from evening to morning observations, resulting in an artificial cooling of temperature data at the stations affected, as noted by Karl et al. 1986.  In a lecture, Karl noted:

"There is practically no time of observation bias in urban-based stations which have taken their measurements punctually always at the same time, while in the rural stations the times of observation have changed.  The change has usually happened from the afternoon to the morning.  This causes a cooling bias in the data of the rural stations.  Therefore one must correct for the time of observation bias before one tries to determine the effect of the urban heat island"

Note in Watts Figure 16, by far the largest adjustments (in the warming direction) are for rural stations, which is to be expected if TOB is introducing a cool bias at those stations, as Karl discusses.

Fig 16a

Instruments Change, Stations Move

As Zeke Hausfather has also discussed, the biggest network-wide inhomogeneity in the US record is due to the systematic shift from manually-read liquid-in-glass thermometers placed in a louvred screen (referred to in the U.S. as a Cotton Region Shelter and elsewhere as a Stevenson screen) to automated probes (MMTS) in cylindrical plastic shelters across large parts of the network in the mid- to late-1980s.  This widespread equipment change caused an artificial cooling in the record due to differences in the behaviour of the sensors and the sheltering of the instruments.  This is discussed in a number of papers, for example Menne et al. 2009 and 2010, and like TOB does not appear to be accounted for by Watts et al.

Additionally, the Watts paper does not show how or whether the raw data were adjusted to account for issues such as sites closing or moving from one location to another. The movement of a site to a location with a slightly different mean climatology will also result in spurious changes to the data. The Watts paper provides no details as to how or whether this was accounted for, or how the raw data were anomalised.

homogenized

Quite simply, the data are homogenised for a reason. Watts et al. are making the case that the raw data are a ‘ground truth’ against which the homogenisations should be judged.  Not only is this unsupported in the literature, the results in this paper do nothing to demonstrate that.  It is simply wrong to assume that all the trends in raw data are correct, or that differences between raw and adjusted data are solely due to urban heat influences.  However, these wrong assumptions are the basis of the Watts conclusion regarding the 'spurious doubling' of the warming trend.

The Amplification Factor

The conclusion regarding the lower surface temperature warming trend is also at odds with the satellite temperature data.  Over the continental USA (CONUS), satellites show a 0.24°C per decade warming trend over the timeframe in question.  According to Klotzbach et al. (2010), which the Watts paper references, there should be an amplification factor of ~1.1 between surface and lower troposphere temperatures over land (greater atmospheric warming having to do with water vapor amplification).  Thus if the satellite measurements were correct, we would expect to see a surface temperature trend of close to 0.22°C per decade for the CONUS; instead, the Watts paper claims the trend is much lower at 0.155°C per decade. 

This suggests that either the satellites are biased high, which is rather implausible (i.e. see Mears et al. 2011 which suggests they are biased low), or the Watts results are biased low.  The Watts paper tries to explain the discrepancy by claiming that the amplification factor over land ranges from 1.1 to 1.4 in various climate models, but does not provide a source to support this claim, which does not appear to be correct (this may be a reasonable range for global amplification factors, but not for land-only).

A discussion between Gavin Schmidt and Steve McIntyre on this subject led to the conclusion that the land-only amplification factor falls in the range of 0.78 to 1.23 (average over all global land areas), with a model mean close to 1 (using a script developed by McIntyre on 24 different models).  Note that McIntyre is a co-author of Watts et al., but has only helped with the statistical analysis and did not comment on the whole paper before Watts made it public.  We suggest that he share his land-only amplification factor discussion with his co-authors.

Another important consideration is that the amplification factor also varies by latitude.  For example Vinnikov et al. (2005) found that at the CONUS latitude (approximately 40°, on average), models predict an amplification factor of approximately 1 (see their Figure 9).  Note that this is the amplification factor over both land and ocean at this latitude.  Since the amplification factor over land is less than that over the oceans, this suggests that the amplification factor over the CONUS land may even be less than 1. 

Combining the latitude and land-only status of the CONUS, the amplification factor may very well be less than 1, but a range of values significantly lower than the 1.1 to 1.4 range used in the Watts paper would be reasonable.

Note also that as discussed above, the satellite data (like all data) are imperfect and are not a 'gold standard'.  They are a useful tool for comparison in this study, but the satellite trends should not be assumed to be perfect measurements.

More Apples and Oranges

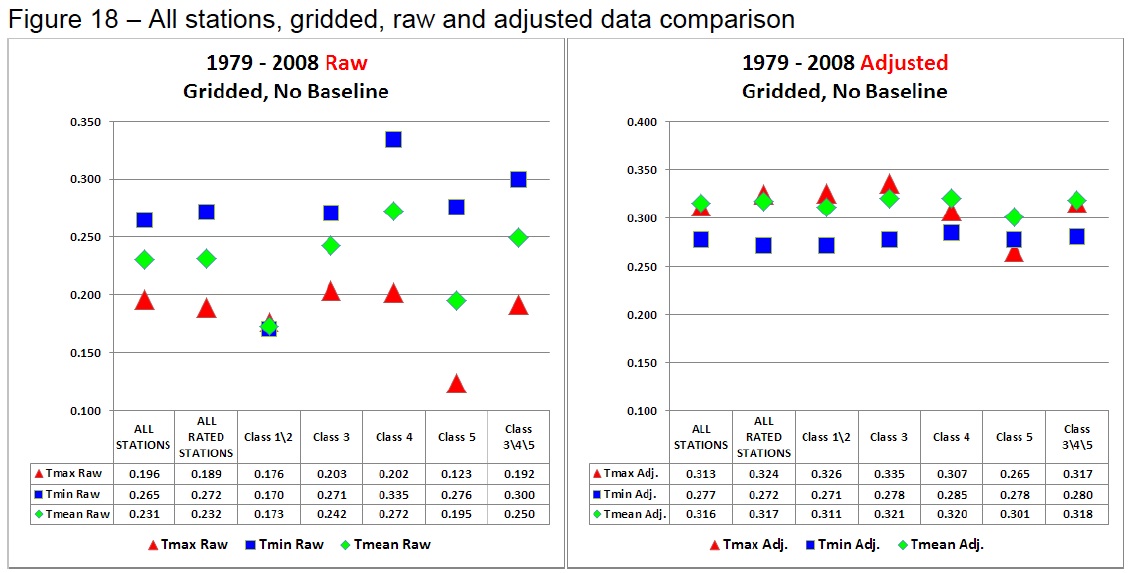
Watts et al. compare the best sited Class 1 and 2 stations (using their categorisation) to the total homogenised network. Strictly speaking, this is comparing apples and oranges; Watts' data are an inhomogeneous sub-sample of the network compared to a homogeneous total network. In practice, this methodological error doesn’t make much difference, since the homogenisation applied by NCDC produces uniform trends in all of the various classes.

However the use of a smaller network has disadvantages. When taking a gridded average of a sparse network, the impact of inhomogeneities is likely amplified and the overall uncertainty of variability and change in the timeseries increases.

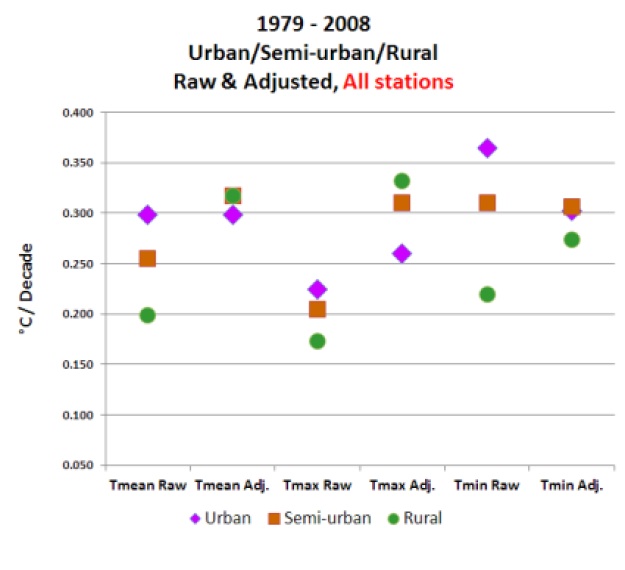
The Class 1 & 2 sites used by Watts in this context represent just 20% of all the total CONUS network.  The comparison of the raw Class 1 & 2 sites with the same network of homogenised data in Watts' own Figure 18 indicates likely inhomogeneities in that raw data.  Watts et al. argue that the raw and adjusted Class 1 & 2 trends in Figures 18a and 18b are so different because "well sited stations are adjusted upward to match the already-adjusted poor stations," but this is simply not how the homogenization process is done.  In reality the difference is likely due to the  biases we have discussed above, indicating that the Watts raw data is inhomogeneous and influenced by these non-climate effects.

fig 18

Determining whether or not the Class 1 & 2 raw data is homogeneous is therefore a key requirement of a revised manuscript.  And since the Class 1 & 2 sites have been selected for good exposure, Watts et al. would need to show the cause of any statistical discontinuities that they find. This work has already been done by NCDC in the Menne at al. papers, which show influences from the range of factors discussed above, and not just urban influence.

The Watts final conclusion that adjusted temperature trends are 'spuriously doubled' (0.155°C vs. 0.309°C per decade raw vs. adjusted data) relies on a simple assumption — that the raw data must be correct and the homogenised data incorrect.  There is no a priori basis for this assumption and it is unsupported by the literature.

Adjustments Make Little Difference Globally

While Watts et al. identify possible issues concerning the adjustments applied to station temperature records, it wisely makes no attempt to assess the global impact of the adjustments, which are beyond the scope of the work. Nonetheless, this is a significant question from a public interest perspective.

In order to answer this question, we willl try and estimate the maximum possible impact of station adjustments on the instrumental temperature record.  To minimise the warming signal, we will use the simplest method for calculating a global temperature average - the CRU method, which is known to yield poor coverage at high latitudes and hence underestimate recent warming.  Further, we'll assume that entirety of the data adjustments are wrong (ignoring proven bias corrections such as TOB).  If we calculate land temperature averages from both the raw and adjusted data, we can see how much difference the adjustments make. The result is shown in the figure below (red and green lines).

Figure 1: Impact of GHCN adjustments.
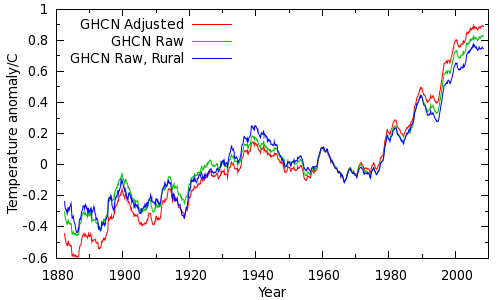
Just to be absolutely sure, we can do a further calculation using just rural unadjusted data (using the GHCN station classifications) - the blue line.

While the adjustments do make a difference, the difference is small compared to the overall warming signal since 1979. Using a more sophisticated temperature calculation reduces this difference. Furthermore, we are only looking at land temperatures - 30% of the planet. Including the remaining 70% of the planet (the oceans which, if not precisely rural, are certainly not urban!) dramatically reduces the remaining impact of the GHCN adjustments.  Indeed, comparison of warming trends over the oceans and over large inland lakes (including the North American Great Lakes) shows a high degree of consistency with terrestrial trends. Warming over the oceans and lakes is presumably not due to urbanisation.

The entire CRU-type calculation requires 65 lines of python code (by comparison, a modern airliner requires upwards of a million lines of code to fly).  The code is available below.
Show code

Many others have done this comparison, including Caerbannog and Zeke HausfatherFawcett et al (2012) provide a comprehensive assessment of the sensitivity of Australian temperature trends to network and homogenisation choices, including comparison with an unhomogenised gridded analysis of Australian temperatures. Furthermore, the BEST project has obtained a similar result with a different, independent implementation of the station homogenization algorithm.  It would be surprising if an independent approach were to yield a similar but incorrect result by chance.

Do the overall adjustments make a difference?  Yes.  Are they justified?  Yes, according to the body of scientific literature.  Watts raises a scientific issue, but one which only affects part of the adjustment.  Does it matter?  Not very much.  Even if the entirety of the adjustments were wrong, we still see unprecedented warming over the past 40 years.  And there is certainly not a factor of two difference between global warming trends in the raw and adjusted data.

Constructive Criticisms

It's worth noting that Peter Thorne of NCDC was interviewed by Andrew Revkin, and discussed three papers which NCDC has recently published (see here, here, here).  In the first of those linked papers, they actually concluded that there likely remains a residual cool bias in the adjusted data, and that the adjusted data are consistent with reanalysis data (detailed in the third linked paper).  Watts et al. do not address these papers.  Ironically Watts responded to that interview by saying that Thorne needs to get out into the real world, but it is Watts et al. who have not accounted for real world effects like TOB, station movement, instrument changes, etc.

In its current form, the Watts paper contains little in the way of useful analysis.  There are too many potential sources of bias which are not accounted for, too many apples-to-oranges comparisons, and they cannot draw any conclusions about urban heat influences until their data are homogenized and other non-climate influences are removed.

The primary conclusion of the paper, aside from not being supported by the analysis, is simply implausible.  The CONUS surface warming trend proposed by the Watts paper appears to be inconsistent with the satellite observations, and overall global trends in raw data do not differ dramatically from those in the adjusted data.  Comparing raw to adjusted data globally shows a rather small difference in long-term trends; far smaller than a factor of two.

The flaws we have identified entirely compromise the conclusions of the paper.  Ultimately Watts et al. assume that all adjustments are 'spurious' unless due to urban heat influences, when in fact most of their identified discrepancy likely boils down to important adjustments for instrumental changes, TOB, and other influences they have not accounted for in their analysis.  Watts et al. attempt to justify their assumption by asserting "well sited stations are adjusted upward to match the already-adjusted poor stations," but this is simply not how the homogenization process is done.

Fortunately McIntyre has acknowledged that TOB must be considered in their analysis, as has Watts, which is a good start, but they must also account for the other biases noted above in order to draw any valid conclusions about urban heat influences.

In conclusion, Watts et al. of course deserve the right to try to make their case in the peer-reviewed literature, however implausible that case appears to be.  Therefore, we hope they will consider addressing the important concerns detailed above before they submit the paper to a journal.  Otherwise we suspect the paper will not fare well in the peer review process.  With said caveats carefully addressed and the conclusions amended if and where necessary, the paper has the potential to be a useful contribution to the climate science literature.

1 0

Printable Version  |  Link to this page

Comments

1  2  3  Next

Comments 1 to 50 out of 117:

  1. Here's my best attempt at a global land-ocean comparison of the adjusted, raw, and raw/rural data. I've used the HadSST2 data for the ocean part. The algorithm is very similar to GISTEMP, and the results are very close to GISTEMP too (very slightly higher because I don't have a UHI correction). The difference between the curves is now very small. Part of that is the inclusion of the SSTs, with the ocean covering a far larger portion of the planet than the land stations of course. However a second factor is that using only the rural data reduces coverage in the simple CRU-like algorithm, which also impacts the results. This is very recent code, and rather more complex than the simple implementation provided above, however the agreement with GISTEMP gives me some confidence. Nick Stokes' TempLS code could do a better job, and is far more mature.
    1 0
  2. Link to Kevin's image @1
    0 0
  3. Good article. It will be interesting to see what response Watts has. When I click the "as has Watts" link at the end of the post I get an error message.
    0 0
  4. Good article, but I wish things like this were avoided: "With said caveats carefully addressed and the conclusions amended if and where necessary, the paper has the potential to be a useful contribution to the climate science literature." There's no need to be vituperative, but there's also no need to encourage this enterprise as if it was really an honest attempt to clarify climate science.
    0 0
  5. michael - thanks, link fixed. JohnHarrington - the statement you quote is true. It would be interesting to see what kind of difference this new UHI adjustment process has on the data. It's not going to make much difference as shown in the post above, but it would still be interesting to see, and any improvement to the temperature record is a useful contribution. Whether their attempts were honest or not isn't the issue. The question is whether they can make a valuable contribution to the science. They can, if they try to.
    1 0
  6. Dana... And I actually think that speaks to Anthony's approach to science. Scientists generally start from a position of "here's something we don't yet fully understand, so I want to study this to help expand our understanding." From there the results of the research are what inform the conclusions. Anthony seems to go the opposite direction, starting with the conclusion that he believes is true and tries to work toward that end. Eli Rabett has an interesting perspective that he put forward on this issue. He says:
    What amateurs lack as a group is perspective, an understanding of how everything fits together and a sense of proportion. Graduate training is designed to pass lore from advisors to students. You learn much about things that didn't work and therefore were never published [hey Prof. I have a great idea!...Well actually son, we did that back in 06 and wasted two years on it], whose papers to trust, and which to be suspicious of [Hey Prof. here's a great new paper!... Son, don't trust that clown.] In short the kind of local knowledge that allows one to cut through the published literature thicket. But this lack makes amateurs prone to get caught in the traps that entangled the professionals' grandfathers, and it can be difficult to disabuse them of their discoveries. Especially problematical are those who want science to validate preconceived political notions, and those willing to believe they are Einstein and the professionals are fools. Put these two types together and you get a witches brew of ignorance and attitude.
    Link
    1 0
  7. Rob @6 - I agree, as the post notes, the downfall if this paper (at least this first draft) is that they went looking for UHI bias, convinced it must exist. Somewhere I saw a quote from Watts saying something like 'even though we didn't find a UHI bias in Fall and BEST, we knew it had to be there, so we tried this approach instead'. That's a dangerous approach, basically not resting until you find the result you want, which makes you susceptible to confirmation bias. I think that's what happened here. They wanted to find UHI, they ran an analysis which superficially seemed to fit the bill, so they simply assumed it was indicative of UHI. They're certainly not the first to make mistakes due to confirmation bias, and they won't be the last. That said, they still have the opportunity to fix the problems we've discussed in our post and make a useful contribution to the scientific literature. It will be interesting to see if they're willing to do this, because it will require dropping that conclusion that they wanted to confirm, because it's simply not correct.
    1 0
  8. My take-away from Dana and Kevin's excellent analysis: Watts et al was not ready for prime-time!
    0 0
  9. As a side note on dana1981's comments, a paper investigating potential biases in surface temperature records is still interesting if the conclusion is that the biases are insignificant. At the very least such a paper clears that particular issue off the table. Starting with your conclusions and searching for support, on the other hand, is a fast path to error. In science you have to see where the evidence takes you, not hunt for confirmation of your pre-existing opinion.
    0 0
  10. Dana... Even if they clearly find that there is no influence from station siting, that is still useful information to know. It's just as important to know what things aren't as it is to know what things are. I've even said as much to Anthony in the past but I don't think the comment got through moderation.
    0 0
  11. " Somewhere I saw a quote from Watts saying something like 'even though we didn't find a UHI bias in Fall and BEST, we knew it had to be there, so we tried this approach instead'." He's said (paraphrase) that he and Evan *knew* badly sited sights *must* be inflating the true trend because of "the physics of heat sinks".
    1 0
  12. KR and Rob - exactly. There's a new methodology out there to classify temperature stations, and I'd like to know if it makes any difference in UHI adjustments or the temp record in general. As you note, even if it doesn't (and it certainly won't make a big difference, as we've shown), that's still a useful result. But they can only get at the right answer if they do the analysis properly. dhogaza - yes, that's the quote I was talking about. Do you know where it came from? I thought I saw it in the initial press release post, but I don't see it there anymore. I wonder if Watts deleted it.
    0 0
  13. "Dana... Even if they clearly find that there is no influence from station siting, that is still useful information to know." Other people have shown this, of course. Watts has re-classified stations according to the latest WMO standards which have only been adopted in the last year or so (or claims to have done so, he's not revealed his algorithm for doing so). Publshing on the result of the re-classification is marginally interesting and worth a paper, I should think. Of course, the conclusion, "homegenization gives a false inflated trend" doesn't follow from the work done in the paper, as he simply asserts it.
    0 0
  14. dana1981 - From the Backstory on the new surfacestations paper:
    After Muller could not find strong signal that we knew must be there by physics of heat sinks…and neither could we in Fall et al 2011, we went looking, and discovered the new Leroy 2010 classification system and WMO ISO approval. ...
    (Emphasis added)
    0 0
  15. Oh joy, co-author John Christy is reporting the results of Watts 12 to Congress, knowing the large issues. Wow.
    0 0
  16. Ah it was in the backstory, thanks KR. That mindset - 'we knew it must be there, even though not shown in the data, so we went looking for it in other data' can be problematic, and we're seeing the results here. dhogaza - we're in agreement. Doing the analysis properly with the reclassification scheme would be worth a paper. It's not going to yield an earth-shattering result if they do it right (in fact it will almost certainly be a marginal difference), but useful nonetheless.
    0 0
  17. grypo @15 - yes, from what I heard Christy didn't mention the Watts results in his verbal testimony, but he does reference them in his written testimony. Really big no-no referencing unpublished, unreviewed results in congressional testimony. The same criticism could be applied to Muller when he told Congress about preliminary BEST results, but at least those results were pedestrian, just confirming what we already knew. Telling Congress that everything we thought we knew was wrong based on extremely preliminary results - that's simply unprofessional and wrong.
    1 0
  18. JohnH@4: Though I tend to agree with you, I'd welcome Watt's contributions *IF* they were done in a true and concertedly scientific way. I'd posit that someone here, who may have some conection to Anthony, invite him to *politely* discuss Dana and Kevin's analysis, in the SkS spirit. As a working scientist, and having followed this WUWT kerfuffle (a honest-to-injun real sciency word, BTW!) for quite a few years, I have a high disregard for most of WUWT and its followers. That said, I'm reminded of a stone-cold denier, which whom I've been having email exchanges with for about 3 years now: Trust me when I say they did *not* start off nicely! However, through perserverance and ooodles (another sciency word!) of data submission, he is actually now a real skeptic, no longer a fake one. I was gracious, held my tongue (a ~difficult-for-me-to-do~ act, sometimes), and stayed on point. I'd welcome Watt's "conversion," especially if SkS was the vector it originated in! Today, Muller: Tomorrow.....;)
    1 0
  19. McIntyre (listed as a co-author on Watts' paper) appears to be distancing himself from the paper: http://www.washingtonpost.com/blogs/capital-weather-gang/post/more-evidence-attention-grabbing-climate-studies-prematurely-rushed-and-potentially-flawed/2012/07/31/gJQAYJkCNX_blog.html "The blogosphere has quickly pointed out two problems with Watts’ estimates: 1) Independent satellite data - which Watts posts on his blog each month and has stood behind - indicate a warming over the U.S. closer to NOAA’s estimate. This point was raised by ClimateAudit blogger Steven McIntyre: “Over the continental US, the UAH satellite record shows a trend of 0.29 deg C/decade (TLT) from 1979-2008,” McIntyre said. Interestingly, McIntyre is listed as a co-author of the Watts paper but begins a blog post expressing “puzzlement at Anthony’s [Watts’press release] announcement”and qualifies his involvement as “very last minute and limited”. And he admits to not having “parsed” parts of the Watts study." . . . McIntyre also addressed [the TOB]problem: “There is a confounding interaction with TOBS [time of observation] that needs to be allowed for, as has been quickly and correctly pointed out.” Hmm, I wonder how long it's gonna take for everyone to get 'on message'.
    1 0
  20. grypo - Christy's written testimony included the following (incorrect!) myths as his five summary points: (1) 'The recent “extremes” were exceeded in previous decades.' (2) Not as much warming as models predict. (3) Urban Heat Islands/bad surface records. Quoted Watts problematic draft, also see Temp record is unreliable. (4) Consensus reports misrepresentative of climate science. (5) CO2 is plant food, and CO2 limits will hurt the poor. No kidding - those really are points 1-5 of 5. Bring your shovel and some aspirin to read.
    1 0
  21. It shouldn't be surprising that the UHI effect is not a big source of error in the temperature trend, because a stable temperature bias because of bad siting will not affect the trend. Errors in the trend will result only if the UHI effect becomes worse (or better, of course) during the recording period. There's probably a certain amount of this, due to urbanization and expansion of cities, but it seems unlikely that it could constitute a major source of error in the overall trend. Changes in instrumentation, station location and construction, and recording time are far more likely to introduce spurious trends. So Watts really needs to separate these corrections if he wants to conduct a serious study of the matter. It really sounds like Watts rushed out a half-baked study in an effort to steal the thunder from the Muller papers.
    0 0
  22. It shouldn't be surprising that the UHI effect is not a big source of error in the temperature trend, because a stable temperature bias because of bad siting will not affect the trend.
    What are you talking about? I'm not sure if you realize this, but the population (and thus urbanization) had been increasing rather dramatically of late.
    Interestingly, McIntyre is listed as a co-author of the Watts paper but begins a blog post expressing “puzzlement at Anthony’s [Watts’press release] announcement”and qualifies his involvement as “very last minute and limited”. And he admits to not having “parsed” parts of the Watts study."
    It seems there was some miscommunication there. McIntyre made a contribution and is offering to make more of one, but he didn't actually agree to be a co-author; Watts assumed. McIntyre may well end up as one though, but he wants more time to do the TOB calculations and review the paper more thoroughly before deciding. That whole thing was unfortunate, but also I'm convinced inadvertent.
    0 0
  23. One of the ironies in all of this is the fact that Urban Heat Islands are totally anthropogenic.
    0 0
  24. Christoph Dollis - Yes, population and urbanization has increased considerably. But urbanization is checked as a biasing influence against rural sites, many urban stations have improved (moving stations from rooftops or next to buildings to nearby parks, for example), equipment has changed over the decades, the TOBS issue primarily effects rural stations, etc. To examine UHI you need to look at the whole picture, all of the data, and not just assume that an effect exists. That can lead you directly to a Common Sense error - falling prey to assumptions that more experience would correct.
    1 0
  25. Dana: "dhogaza - we're in agreement. Doing the analysis properly with the reclassification scheme would be worth a paper. It's not going to yield an earth-shattering result if they do it right (in fact it will almost certainly be a marginal difference), but useful nonetheless." It's sad, when you think of it. If Watts wasn't so blinded by his ideological beliefs, he'd be able to put together a modest paper making a modest contribution (assuming his classification methdology holds up). Quite an accomplishment for a high school graduate with obviously limited analytical skills, as was his getting his earlier classification work into Fall et al. Of course his ideological beliefs (egged on by RPSr, the godfather of the surface stations project) were the only reasons he took on the project in the first place. Lots of irony to ponder here.
    0 0
  26. "It seems there was some miscommunication there. McIntyre made a contribution and is offering to make more of one, but he didn't actually agree to be a co-author; Watts assumed. McIntyre may well end up as one though, but he wants more time to do the TOB calculations and review the paper more thoroughly before deciding. That whole thing was unfortunate, but also I'm convinced inadvertent." How does one indavertently list someone as a co-author on a paper without asking first?
    0 0
  27. dhogaza - I would be willing to attribute the author issue to inexperience: this is (by his own admission) Watts first experience as primary author, and the urge to credit folks may not have been tempered with the need to make certain that anyone whose name was associated with the paper fully agreed with methods, data, and conclusions. I have, in the past, informed authors that they were not permitted to have my name linked in any fashion with their papers, despite being associated with some of the data, despite their request, as I completely disagreed with their methods.
    1 0
  28. There is an interesting point about the amplification factor. Comparing the NCDC adjusted to the UAH data for the US48 from 1979-2008 I find an amplification factor of 0.77. However, the mean of amplification factors for 30 year trends starting with Dec 1978-Nov 2008 and ending with January 1982-Dec 2011 is 0.82 and has a standard deviation of 0.02. That means the period chosen for comparison in Watts 2012 is unusually low, being 2.65 Standard Deviations below the mean. It is not representative, and should not be used for the analysis. Rather, instead of taking just one period for the analysis, Watts should base his analysis on a range of thirty year intervals.
    1 0
  29. KR: "dhogaza - I would be willing to attribute the author issue to inexperience" That's reasonable ...
    0 0
  30. I agree with Tamino’s reaction to both the Watts et al and the new BEST papers as articulated in his Open Mind post, "Much Ado about Nothing.” “A couple of recent events have caused some stir in the climate denial blogosphere. “I’m underwhelmed.”
    0 0
  31. Christoph Dollis at 07:30 AM on 2 August, 2012 What are you talking about? I'm not sure if you realize this, but the population (and thus urbanization) had been increasing rather dramatically of late. Stations that are currently rural have always been rural. So if you want to avoid issues associated with increasing urbanization, the plain and obvious thing to do is process data from stations currently classified as rural. If you do that, you will get results nearly identical to what you get when you process data from all stations (rural *and* urban). The basic algorithm used to compute global-average temperature anomalies from temperature station data really is quite simple -- just look at the python code above. (Don't know enough python to figure out what's going on? Then Google up "python tutorial", brew yourself up a strong cup of coffee, and introduce yourself to python.) Professional scientists and "citizen scientists" alike have all taken cracks at the temperature data; they've taken a variety of approaches, from the ultra-simple, like mine, to the much more sophisticated, like NASA/GISS and Berkeley/BEST. And you know what? We've all gotten the same basic results, for rural, urban, raw, or homogenized data. The global warming signal is so strong that it jumps right out even with the crudest processing methods. Anyone who still thinks that UHI is a significant factor in the global-average results published by NASA/etc. just hasn't taken a serious look at the data. In fact, the global-warming signal is so strong that you can get results similar to NASA's even if you throw out 98 to 99 percent of the temperature stations. I've put up some results at docs.google.com that you should look at: They show a comparison of the official NASA results with the results I got when I processed *raw* data from just 68 *rural* temperature stations scattered around the world. The algorithm I used is even simpler than the one implemented in the python script above. You can find the results at this link. There are 3 image files there: The first shows my "68 rural stations" results vs. NASA's. The second shows a "Google Earth" view of the locations of the stations used by NASA, and the third shows a "Google Earth" view of the stations I used. There is also a README file that explains exactly what I did to generate my results.
    1 0
  32. The Australian Bureau of Meteorology have posted a simple, user-friendly explanation of why "raw" temperature data need corrections to account for site relocation, time of day observation changes, etc (PDF). Very worth reading.
    0 0
  33. "What are you talking about? I'm not sure if you realize this, but the population (and thus urbanization) had been increasing rather dramatically of late." I thought this was pretty obvious, but perhaps it is not; perhaps this kind of quantitative intuition requires scientific training and experience. Let me walk you through it: If you've ever looked out the window while flying across the US, you know that even with increasing population, cities occupy a small fraction of the country's area. But we aren't worrying about the entire city, because the measuring stations that have always been within the city aren't a problem, only the ones that have been engulfed by the city's UHI during the recording period. So we aren't even concerned about the entire area of the city, but only the annulus around the city where the UHI has expanded during the recording period, a fraction of a fraction of the area of the US. That means that any artifactual trend in that small area would be greatly diluted by the unbiased trend measurements from stations that have been rural all along, and also from stations that have been within urban all along. So to appreciably alter the overall trend, any artifactual trend in those "UHI transition zones" would have to be enormous--in which case it would be glaringly obvious and easy to omit or correct it.
    0 0
  34. There have been previous occasions where data homogenization has been discussed on a couple of blogs. Deltoid looked at some data analysis by Willis Eschenbach here, and a New Zealand "skeptics" group here , The latter post has a link to more details at this location. In both cases, raw data was analyzed, in spite of clear metadata indicating station shifts or other known reasons. No surprises - the raw analysis ignoring the real shifts in data ends up with lower trends than the homogenized data that accounts for known issues. Deja vu all over again. The first link mentions an Australian BoM document, but a different one from the one John Cook links to above. (At least, the link is different.)
    0 0
  35. A few thoughts:
    • The good: Reclassifying stations (preferrably globally) according to Leroy 2010 is a good project. Doing so using satellite imagery is a practical approach, although it needs some sort of validation over a subset of stations to check if the results are robust. This would be a great crowdsourcing project, the sort of thing Watts is adept at.
    • The bad: I think Watts' response to the TOBS issue shows that he is not capable of interpreting the results. You don't overturn 25 years of research based on detailed data and meta-data comparisons (see the first 8 papers on this page) on an issue in a couple of days, or even a couple of months.
    • Zeke's article on US temperatures is important. If I have understand it correctly, the fact that the NOAA approach to TOBS correction (based on metadata) and the BEST approach (which ignores the metadata and just looks for inhomogeneities in the data) give similar results is extremely compelling.
    0 0
  36. I'm reminded a bit of Kepler, who (according to at least one biography) wanted to prove certain ideas about the planets and the solar system. These turned out not to be true, but Kepler went on to formulate his law of planetary motion. Which goes to show that you can be searching for your preconceptions and still make interesting discoveries - provided you are honest.
    0 0
  37. A typo in the post listing the paper's authors - it is JR Christy, not some ER Christy. Having given the paper a quick read, I was surprised at how woolly the writing was, usually a symptom in my experience of a student that has yet to sort out what they're actually trying to research. Okay I'm no expert on climatology literature but I don't recall meeting quite such a poor style within that literature before.
    0 0
  38. Dr. Venema has a new post at VariableVariabilty: http://variable-variability.blogspot.de/2012/08/a-short-introduction-to-time-of.html
    0 0
    Moderator Response: [KC] Link fixed. Thanks for that.
  39. Thanks Kevin. I am really glad to see someone offering Watts et al some constructive criticism, which might help them eventually climb out of the hole they have dug themselves in recent years... If Richard A Muller can do it, then so can they (we can but hope)... Typo alert: "It would be surprising is" should I think be "It would be surprising if"... (i.e. end of penultimate paragraph in the 'Adjustments Make Little Difference Globally' section).
    0 0
  40. "Here we offer preliminary constructive criticism, noting some issues we have identified with the paper in its current form, which we suggest the authors address prior to submittal to a journal. As it currently stands, the issues we discuss below appear to entirely compromise the conclusions of the paper." Anthony encourages constructive criticism of his paper. I'm sure he would welcome your feedback in his forum, which encourages open debate -- in the true spirit of the scientific method. I think we all agree that science, especially publicly funded science should be transparent. I encourage everyone to embrace the Open Science movement.
    0 0
  41. Not entirely sure, but an aroma of Poe is in the air...
    0 0
  42. Reg "Poe" Nelson: "Anthony encourages constructive criticism of his paper" He's also said that "the physics of heat sinks" proves that the true trend is 50% that of the commonly accepted trend. And that "the physics of heat sinks" is why he *knows* that there's a pony buried in the data. And, of course, when he posted the paper, he didn't say "here's a draft! comments, please"! Instead, he released a PR that said, unequivocably, that 50% of the accepted trend is due to spurious adjustments to the data. Insane. No rational researcher would put that forward without caveats. Compare with those italian physicists who measured particles traveling faster than the speed of light. They said from the beginning it was probably a mistake.
    0 0
  43. Reg - I actually tried to post a very polite comment on WUWT informing Watts of this post as constructive criticism. My comment never made it through moderation, which is not surprising since my WUWT comments are censored about 90% of the time. Fortunately somebody else was able to get a link to this post through the moderation process, but other than a disparaging and dismissive response by a moderator and a couple of other flippant responses in the comments, it has been largely ignored. So let's just say your confidence that our feedback is welcome on WUWT is not borne out by reality.
    0 0
  44. Watts has always seemed to believe that just about anything NOAA (or any other agency) did to the surface station data was spurious and biased to produce a false warming trend, so it shouldn't be surprising to see the extent to which this assumption drives his study off the rails. Thanks for demonstrating exactly where and why that happens in detail.
    0 0
  45. A couple of comments on my simple python temperature record program from the post, given that it is getting a bit of attention. Python has 2 dialects, the 2.x series and the 3.x series. You need 2.x (latest version is 2.7.2). I suspect that the only change for 3.x is the final print statement. Save the code as ghcn-simple.py. Usage is:
    python ghcn-simple.py inv-file dat-file polulation-class
    Population class is any combination of RSU (rural suburban urban). e.g.
    python ghcn-simple.py gncnm.tavg.v3.1.0.inv gncnm.tavg.v3.1.0.dat RSU
    0 0
  46. This is a bit OT but has numerous parallels to Watts and BEST not crossing all the T's and dotting all the I's before they commit to print, etc. In brief, there is a fair bit of excitement in the skeptic blogosphere already agog with the Watts et al 2012 press release. Their perceived problem with temperature records has now expanded from less than 2% to more than 25% of the earth's surface. This post on John O'Sullivan's blog says it all Breaking courtroom chaos as New Zealand skeptics rout government climatists. Or does it? Richard Treadgold who runs the NZ skeptic blog Climate Conversation Group has posted two comments on O'Sullivan's blog. The second comment includes each of O'Sullivan's post's paragraphs and has square brackets at the end of each paragraph which have been inserted by Treadgold and include a correction or clarification of the O'Sullivan paragraph. Here's an example: New Zealand skeptics of man-made global warming score historic legal victory as discredited government climate scientists perform U-turn and refuse to allow a third party peer-review report of official temperature adjustments to be shown in court. Skeptic lawyers move for sanctions likely to prove fatal to government’s case. [Incorrect.] Note: The third party peer-review report mentioned above involves the Australian Bureau of Meteorology. Why the attention to detail and accuracy by Treadgold which leads to a plethora of corrections to the reported details. The answer lies on his blogsite: With friends like these we need no enemies. Wherein there is the following paragraph: The problem is that the judge hasn’t even made his decision, which my recent posts have made clear. We run a distinct risk of contempt of court if we appear to endorse the wild claims about the state of the case, of legal moves, even of victory, that are beginning to sound around the world. (my emphasis) There is a rich irony in at least one of the other paragraphs penned by Richard Treadgold. I'm not sure he's even aware of the hidden meaning in his words: This morning my inbox was filling up with requests to explain and I could sense some people becoming distinctly over-stimulated by the imaginary achievements of the brave Kiwi sceptics. (my emphasis) Treadgold then lists, in an easy to read format, each of O'Sullivan's paragraphs with a refutation or clarification of each. Gut wrenching stuff but hey that's peer review! There are already references to the O'Sullivan post in the comment section of newspaper opinion pieces in Oz. These faulty references will probably reverberate around the internet for years and become an entrenched part of skeptic folklore. Similarly for non-peer-reviewed press releases that may sink in a sea of irrelevance.
    0 0
  47. Dana #43: Following the intervention of Lucy Skywalker, I seem to have been allowed to comment on WUWT (just so long as I don't mention the D-word, call Watts a hypocrite, remind readers of his egotistical sensitivities, or point out the misleading nature of his World Climate Widget). As such, my moderation failure rate at WUWT is down to about 25%, so I would recommend perseverance. Most recently, I have succeeded in getting through with a comment encouraging Watts to either address criticisms or embrace oblivion.
    0 0
  48. Dana@43: Every so often, and against my better instincts, I'm compelled to go read up at WUWT, especially in cases such as yours, where someone on a rational blogsite mentions it. I really gotta stop that....it's like whacking meself in the head with a illogical ad hom hammer....! Thanks for your attempt to be rational and helpful: Reading the responses to your well-reasoned post on WUWT reminds me that: -This website is invaluable to those of us who actually do follow and understand the scientific method, and; -Reminds me NEVER to even try to post anything that smacks of logic and reason there. To the topic, as I read Watt's paper, I see precisely where it falls *way* short of being accepted in any decent journal, and even so, I look forward to its analysis by those much more qualified to interpret it than I. To Martin@47: You're a better man than I, Gunga Din.....
    0 0
  49. Just saw this little gem over at WUWT: Ric Werme says: August 3, 2012 at 1:58 pm ........... It might be interesting to take pre and post homogenized data and see how that displays and analyzes. Is there anyone here who can help this poor guy out? ;)
    0 0
  50. One of the things that's been amusing me about this 'paper' is that it's being referred to as Watts 12. There's a huge assumption here that it will actually find publication this year. Given the extremely poor quality of the first draft, and the length of time it would require to salvage anything from it, let alone to re-write, submit, review, refine, accept, and print any future version, the '12' appellation is optimistic indeed.
    0 0

1  2  3  Next

You need to be logged in to post a comment. Login via the left margin or if you're new, register here.


The Consensus Project Website

THE ESCALATOR

(free to republish)


© Copyright 2024 John Cook
Home | Translations | About Us | Privacy | Contact Us