Climate Science Glossary

Term Lookup

Enter a term in the search box to find its definition.

Settings

Use the controls in the far right panel to increase or decrease the number of terms automatically displayed (or to completely turn that feature off).

Term Lookup

Settings


All IPCC definitions taken from Climate Change 2007: The Physical Science Basis. Working Group I Contribution to the Fourth Assessment Report of the Intergovernmental Panel on Climate Change, Annex I, Glossary, pp. 941-954. Cambridge University Press.

Home Arguments Software Resources Comments The Consensus Project Translations About Support

Twitter Facebook YouTube Mastodon MeWe

RSS Posts RSS Comments Email Subscribe


Climate's changed before
It's the sun
It's not bad
There is no consensus
It's cooling
Models are unreliable
Temp record is unreliable
Animals and plants can adapt
It hasn't warmed since 1998
Antarctica is gaining ice
View All Arguments...


Username
Password
New? Register here
Forgot your password?

Latest Posts

Archives

CO2 Problems: Parallel concerns breed parallel denial

Posted on 10 November 2011 by chuckbot

You are likely already aware of the CO2 problem: ?trace gasses (primarily carbon dioxide) in the earth’s atmosphere alter its thermal properties, causing it to retain heat. Human activity, primarily the burning of fossil fuels, is increasing the carbon dioxide content of the atmosphere and as a result heating up the earth’s surface. However, a less appreciated fact is that in addition to being a greenhouse gas, carbon dioxide is acidic. This is not at all controversial; it was well recognized more than a century ago in Svente Arhennius’s pioneering article 'On the influence of carbonic acid in the air upon the temperature on the ground’.  When we burn fossil fuels, we add CO2 to the atmosphere, but about a quarter that carbon winds up in the oceans. This increases the acidity of the oceans, with potentially severe repercussions for organisms like corals, which build shells out of calcium carbonate and suffer under more acidic conditions. The chemistry is relatively straightforward, and not especially controversial; if you would like more information on the subject, Skeptical Science has an excellent introductory series written by Doug Mackie, Christina McGraw, and Keith Hunter.

When the science of anthropogenic climate change proved politically and economically inconvenient for many people, a cottage industry has popped up in trying to dismiss it. The same effort to dismiss ‘the other CO2 problem’ is now underway; there have been a few snipes from Monckton and the Idsos, but I want to focus on some recent congressional testimony in this vein, coming from a Dr. John Everett. A copy of his testimony can be found here. I think it's important to go through this testimony, because it is one of the only pieces of high-profile misinformation on the subject, and because it shows similar distortions at work behind the denial of climate change and ocean acidification. As you read on, ask yourself: have I seen this tactic before? Graphs manipulated so as to hide an incline? An extrapolation of a few years' worth of climate data? "It's changed in the past"?

What’s a pollutant?

Much of the debate recently has been over the Environmental Protection Agency’s jurisdiction in regulating carbon dioxide; to this end, ‘skeptics’ like Dr. Everett often claim that because it is a natural substance with important natural roles, carbon dioxide is not a pollutant.  This is not a very good argument: there are plenty of chemicals which in some situations are essential, but problematic in others. Stratospheric ozone protects me from ultraviolet light, which causes skin cancer.  But near the surface, ozone is a component of photochemical smog, interferes with photosynthesis, and causes respiratory illness. Tropane alkaloids are what make deadly nightshade deadly, but they’re the antidote to sarin nerve gas. Hydrochloric acid is important in my stomach, where it helps me digest food- but I don’t want to get it in my eyes.

A pollutant is an ecophysiological poison, and poisons are situational: whether or not a substance is poisonous depends upon its amount, the rate it’s encountered, and other factors. The reality of ocean acidification justifies describing CO2 as a pollutant in the current environmental context.

Pedantic Semantics

Dr. Everett starts off his testimony on a low note, saying, 

 'Importantly, oceans are alkaline – not acidic, so use of the term “acidification” unnecessarily promotes fear.'

To his credit, this is great PR. It’s snappy, it’s to the point, it sounds nice, it’s easily remembered and repeated. But it’s scientifically vacuous. If a solution has a pH above 7, it is basic. If its pH drops, it has become more acidic- acidified- even if the solution is still basic. If the pH of a solution changes from 9 to 8, the solution has acidified, even though it is still basic. If someone who’s fallen off a bridge says, 'I’m falling doooooooooown’, Dr. Everett’s remark would be like saying, ‘You‘re not falling DOWN! You‘re still way UP in the air!’ The most charitable explanation I can come up with is that he’s confusing the rate of change in a variable (acidification) with the variable itself (acidity). His testimony, we will see, is characterized by this sort of confusion.

Or maybe he just wants to play word games.

Fizzix

‘Something is very wrong’ with our understanding of carbon geochemistry, Dr. Everett declares - therefor we should ‘give the information on its impacts a second look.’ What are his concerns?

First, he revisits ‘the bombshell from Bristol,’ a paper by Wolfgang Knorr which found that the fraction of CO2 emissions which remain in the air hasn’t changed significantly over the past 160 years. Though it does not remotely challenge the AGW consensus, Knorr’s paper was picked up by the ‘skeptic’ blogosphere. Curiously, Everett’s citation for the paper is botched - its cautious title (‘Is the airborne fraction of anthropogenic CO2 increasing?’) has been replaced with a more decisive headline popular amongst the ‘skeptic’ interblogs  (‘No Rise of Atmospheric Carbon Dioxide Fraction in Past 160 Years’) What does the paper say? Basically, it finds evidence that the ocean and land haven’t slowed down as carbon sinks - they are still absorbing carbon emissions at the same rate as during the mid 19th century.

It’s hard to see how Knorr’s results support Everett’s opinion that projections of future acidification are overestimates. CO2 emissions have to go somewhere. If the fraction which remains in the air doesn't change, then the fraction which goes other places, like the ocean, can't change either. In fact, if Knorr’s results are correct and the carbon sinks are stable, then ocean acidification will continue unabated because CO2 will continue to flow into the ocean at the present rate.

Next, Dr. Everett claims to find a decline in the rate at which CO2 is building up in the atmosphere. First, he makes the long-term trend in CO2 accumulation rates disappear by stretching his graph of the data to be three times as wide as it is tall: 

Dr. Everett presents the rate of change in atmospheric carbon dioxide. What is wrong with this image?

Fig 1. Taken from the written statement of Dr. John Everett before Senate EPW hearing on “EPA's Role in Protecting Ocean Health”, May 11, 2010. 

I want to believe that no one would intentionally use such an insultingly transparent trick to hide an incline, but then again there’s this.

Then, he takes the last decade or so of this data, draws a line through it, finds no significant trend, and declares that the quantity is declining. If this sounds familiar, you’re right- do the same thing with HadCRU temperature data and you find that global warming stopped in 1998. It’s amazing!

Linear regressions have been fit to every 8-year period in this data on annual CO2 growth rate. What a mess!

Fig 2. Global CO2 rate data taken from Thomas Conway and Pieter Tans, Annual Mean Carbon Dioxide Growth Rates NOAA/ESRL.

If we apply his technique to the whole data set, we see that 8-12 years are not enough to say much about the longer term trend. Would extrapolating the sharp upswing in 1991-1999 have been a good idea? Would it have been justified? What about the sharp downswing in 1986-1994? It’s pretty clear that projecting patterns from a decade of this data a century into the future is risky at best. And he’s doing it in the face of a clear upward trend at longer timescales!


Intercomparison of various CO2 scenarios

Fig 3. MLO data from Pieter Tans and Ralph Keeling. Mauna Loa Annual Mean Data, NOAA/ESRL/Scripps. IS92a Scenario from IS92a CO2 concentrations. Dr. Everett's projection (described in his remarks in part II) is based upon the assumption of a constant accumulation rate of 1.87 ppm/year; the extrapolations based on MLO (1959-present) and global (1980-present) rate data are calculated by integrating the least-squares linear fit with the 2009 CO2 concentration as an initial condition.

When we extrapolate the trend in the data as a whole, we find that it actually agrees fairly well with IS92a. And even Dr. Everett’s projection entails significant increases in CO2 over the next century, bringing with it significant acidification. Experiments have demonstrated decreased calcification in shellfish at these levels of CO2 (Gazeau et al 2007).

BiLOLogy 

Dr. Everett doesn’t trust ocean acidification experiments, though- he claims that ‘the peer review process has warts’. Although he brings up a number of issues, they are all somewhat specious. He claims that experiments have not been carried on long enough to allow organisms to adapt to high-CO2 environments... however, a paper which he describes as ‘Perhaps the most thorough review of the literature on acidificaton impacts’ suggests exactly the opposite: experiments may not be continuing long enough to show the full severity of the problem!

'Although suppression of metabolism under short-term experimental conditions is a "sublethal" reversible process, reductions in growth and reproductive output will effectively diminish the survival of the species on longer time-scales.' (Fabry et al. 2008).

Two of the authors he cites have rebutted, pointing out a number of misrepresentations of their work.  Dr. Rodriguez-Iglesias and colleauges found that under high-CO2 conditions, coccolithophores build thicker shells, which is definitely interesting. But does this mean that ‘more CO2 is good’, as Dr. Everett claims? Not really:

‘Dr. Everett’s conclusion that ocean acidification poses no threat to marine organisms is based, in large part, on the Iglesias-Rodriguez et al. (2008) study that showed that calcification within coccolithophores (calcifying phytoplankton) was enhanced under elevated CO2. However, this study also showed that growth rates for these marine algae were simultaneously impaired under high-CO2 conditions.These algae are among the most important sinks of atmospheric CO2 on the planet. Although they release CO2 through calcification, they consume it through photosynthesis (growth). Thus, a shift to enhanced calcification (release of CO2) and reduced growth (consumption of CO2) would substantially reduce the ocean’s ability to sequester CO2 from the atmosphere. [...] The physiology of the whole organism, not simply its ability to calcify, must be investigated to fully assess its ability to survive in a future high-CO2 world.'

The whole thing is worth reading.

Deep Time is Deep

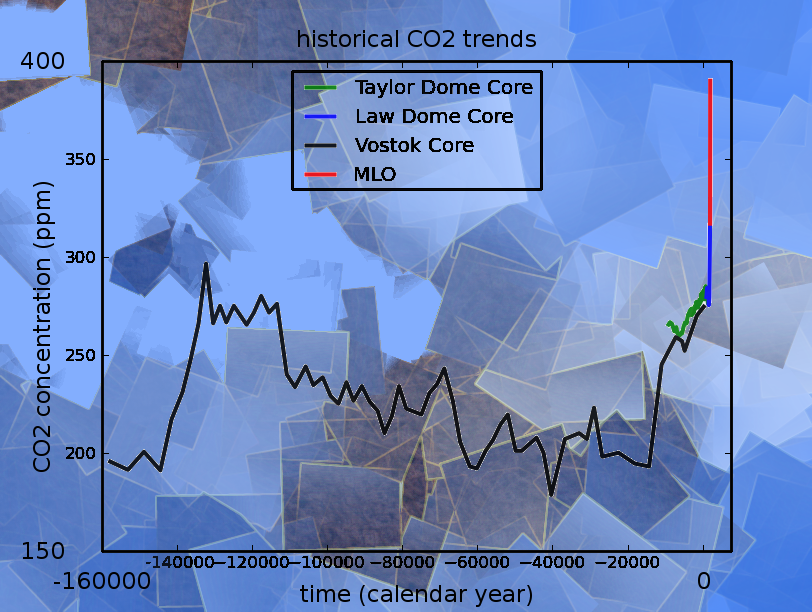
We next hear another common talking point: carbon dioxide levels have changed in the past, so what’s the big deal? To drive the point home, Dr. Everett shows us a graph from the IPCC, showing atmospheric carbon dioxide levels over the last 400 million years. For reference, the magnified section stretches back to before the dinosaurs vanished:

Temperatures and carbon dioxide levels over Deep Time.

Fig 4. IPCC AR4 Working Group I, figure 6.1


But what he fails to consider is that the rate at which environmental variables change can be as important as those variables themselves. The price of evolution is natural selection, and if natural selection culls individuals faster than they can be replaced, the species is in trouble (as well as the species which depend upon it). This is why rapid environmental changes such as the Paleocene-Eocene Thermal Maximum are associated with mass extinction in the geological record. The faster the environmental change, the stronger the selective pressure - and current rates of environmental change may well exceed organisms’ ability to adapt. 

CO2 levels over the last glacial cycle. The current geochemical event is clearly outside of historical bounds at this time scale.

Fig 4. MLO data as with Fig 3; all others from the Paleoclimatology archive of NOAA's National Climatic Data Center. Law Dome data were the 75-year smoothed series from Etheridge, D.M., et al., 2001, Law Dome Atmospheric CO2 Data, IGBP PAGES/World Data Center for Paleoclimatology Data Contribution Series #2001-083. NOAA/NGDC Paleoclimatology Program, Boulder CO, USA. Taylor dome data were from Indermühle, A., B. Stauffer, T.F. Stocker and M. Wahlen, 1999, Taylor Dome Ice Core CO2 Holocene Data. IGBP PAGES/World Data Center-A for Paleoclimatology Data Contribution Series #1999-021 NOAA/NGDC Paleoclimatology Program, Boulder CO, USA. Vostok data were originally published in Barnola, J.-M., D. Raynaud, Y.S. Korotkevich, C. Lorius. 1987. Vostok ice core provides 160,000-year record of atmospheric CO2. Nature 329:408-414; the data were retrieved from the NCDC archives.


Here’s what I mean. If we look at the last glacial cycle, it’s obvious that CO2 has changed over time. The present day is also clearly unusual. But when you consider the rate of CO2 change, our current situation becomes unprecedented.

Here, the rate of CO2 change is calculated over the last glacial cycle. Now the current geochemical event can't be missed - it's larger than the preindustrial era by orders of magnitude.

Fig 6: Same data as Figure 5; rates have been calculated by dividing the difference between successive concentrations by the length of time between them, and assigning the resulting rate to the midpoint of the time interval (ie, given a time series [Ti, Xi], a new time series is constructed [ti, Yi] where ti = (Ti + Ti+1)/2 and Yi = (Xi+1 - Xi) / (Ti+1 - Ti))

Endgame

Wrapping up, Dr. Everett grossly misrepresents a news item to make it appear as though acid rain was ultimately not a problem. He suggests, without further support, that, with global temperature 'having reached a peak several years ago, we are at the start of a cooling cycle that will last several decades or more.’ The earth has changed in the past. Genetic plasiticity will magickally intervene to let organisms adapt at warp speed. ‘With no laboratory or observational evidence of biological disruption, I see no economic disruption of commercial and recreational fisheries, nor harm to marine mammals, sea turtles or any other protected species.’

Don’t you feel less alarmed already?

If you are interested in more detail, a thorough debunking of this testimony may be found here

0 0

Printable Version  |  Link to this page

Comments

Comments 1 to 30:

  1. I don't think it is fair to say "And he’s doing it in the face of a clear upward trend at longer timescales!", the growth rate is so noisy that even over longer timescales the trend is not statistically significant (indeed isn't that Knorr's key finding?). However Everett's error of trying to say that a short term non-significant trend means something is far worse.
    0 0
  2. @Chuckbot: Please add a source citation for each graphic in your article.
    0 0
  3. That reminds me. I have not chased up getting our rebuttals of the "not acidic" claim posted. 1-line, beginner, intermediate, and advanced rebuttals are posted at the link posted in the "basic rebuttal thread" http://www.skepticalscience.com/thread.php?t=2659&r=4 Can who ever does the wrangling of such things please post them in the appropriate places.
    0 0
  4. Excellent article. Small nitpick though, in your third graph the units of the y axis should be ppmv, not ppm/yr.
    0 0
  5. Actually I think Chuckbot has it right, the Y-axis represents the rate of change and not absolute concentrations of CO2.
    0 0
  6. @AlexS Tom Curtis referred to the "third graph" (titled Various CO2 Projections, with an x-axis scale of 1900-2100). It should, indeed, have its y-axis units as ppmv, not ppm/yr.
    0 0
  7. Anything out of it's Natural Balance is a Pollutant Currently the CO2 levels are grossly out of their natural balance and anyone who is honest knows why that is
    0 0
  8. The argument that because the oceans have a ph greater than 7 they cannot be acidifying is like saying that if I travel from Boston to New Orleans then I am not going south because I remain in the Northern Hemisphere.
    0 0
  9. For me, the most important is this conclusion to "report" Dr. John T. Everett: “Before the next IPCC assessment begins, assemble a USA review team and nominees for the IPCC writing and Chair assignments that make up a cross-section of scientific viewpoints. There are qualified scientists in agencies, industry, and among the citizenry who can contribute. Just as we shouldn’t have too many from the energy industry, the same goes for the agencies, universities, and NGOs. We all have biases, even if we think it is the other person who is the one with an agenda. We cannot afford to have homogenous authoring and review teams.” It should read the full "report" (chuckbot ignores several important fragments concerning for example historical acidification, variation of acidification: regional, caused by changes in weather, ocean currents, escape response to temperature and CO2 increases, etc.). I - a long time - I was wondering how - as short as possible - to "help" position Dr. Everett. A good proof of the accuracy of his conclusions is to follow the concentration of CO2 in the period when the continents were already present in "their place" and at least 99% of the current plant and animal species already existed (Pliocene, Pleistocene) and the so-called: Biodiversity is defined as the largest in the history of the Earth. Seki, et al., 2011. write: “Past responses to pCO2 change are important components in resolving these relationships, and the most informative palaeoclimate analogues will be in the recent geological past, when geographical configurations, ocean currents and marine and terrestrial ecosystems were similar to today. “ ... of the current CO2 in the atmosphere: “The current increase in the atmospheric concentration of the greenhouse gas carbon dioxide, from 275 to 285 ppm in pre-industrial times to N380 ppm today, is unprecedented in recent Earth history (Solomon et al., 2007), with present levels exceeding the natural range of at least the last 800 kyr (Siegenthaler et al., 2005b; Lüthi et al., 2008).” But what - really - we know about the concentration of CO2 in the atmosphere at the time (Pliocene and Pleistocene)? Not much. Range of error (for those in scale not distant geological time) is huge, for example regarding the changes: “ However, current Pliocene pCO2 estimates are inadequate to examine such fundamental issues.” and: „Pleistocene pCO2 values range from 250 to 300 ppm and, where the data overlap, they are broadly comparable to EPICA (Fig. 9).” It should be noted that these "Comparable" exists only in pCO2 maxima shown by EPICA (Fig. 9a). The lowest indication of ice cores are well below the lowest (along with standard deviation) of other proxy. Some proxy shows throughout the Pleistocene CO2 concentrations similar to those present, and earlier: “Thus, although the Pliocene warm period pCO2 was higher than pre-industrial levels, it was comparable to current levels or to a level that will be reached in the near future (next few decades).” Is the CO2 pollution was - in this period - also? Changes in the CO2 were also rapidly: “The G. ruber boron isotope record indicates that pCO2 declined substantially from high Pliocene values over a relatively short period between 3.2 Ma and 2.8 Ma (Fig. 10).” In Figure 9a we see, however, that according to one of the proxy (high resolution in time) - in this period (3.2 Ma and 2.8 Ma) - changes can be extremely rapidly (practically vertical lines on the graph), from circa 300 to 450 ppmv - a even (Fig. 9b) the circa 500 ppmv CO2. Currently living plant and animal species on land and sea, or their ancestors had - in the process of evolution - to adjust to the rate of change - as he writes Dr. Everett in his "report". Currently, the theory of evolution tells us that we are dealing mainly with adaptation to rapid changes in the environment rather than adapting to the environment. Dr. Everett also writes about the sinks of CO2 - that may be greater than we think. The sinks of CO2 (for a change - 3.2 Ma and 2.8 Ma), little is known (“Pliocene pCO2 decline we record, the overall trigger(s) that led to these changes in oceanic carbon storage and pCO2 remain elusive.” - Seki, et al., 2011). It is worth to note that most sources of CO2 behaves in accordance with the bell-shaped curve. The increase in temperature often changes them: the sources are the sinks - as he writes NIPCC latest report, for example (page 34): “Wan et al. conclude, ―plant photosynthetic overcompensation may partially serve as a negative feedback mechanism for [the] terrestrial biosphere to climate warming, where ―the photosynthetic overcompensation induced by nocturnal warming can ... regulate terrestrial carbon sequestration and negatively feed back to climate change.” The acidity of the oceans in ancient times - well we know little about it - notes Dr. Everett. The same is found for example Tripati et al. 2011. Calibration of some - of even the best proxy (Boron)- may since lead to huge errors - Pagani et al. 2005: “... values for the Cenozoic yield pH estimates that are relatively invariant, but unrealistically high ...”
    0 0
    Response:

    [DB] See Skywatcher's response to you below.  This is yet another instance of your furnished source not saying what you imply that it does.

    For the general reader, please note that the other source Arkadiusz uses, the NIPCC, is discussed here:

    Let the Prudent Reader beware.

  10. "Next, Dr. Everett claims to find a decline in the rate at which CO2 is building up in the atmosphere." So although we are burning more carbon he says CO2 is not building up proportionally in the air or water. Where does he think it's going? Outer space? Case closed on this guy. Spelling note: it is usually written as Svante August Arrhenius. Thanks a lot for doing this work and writing this up! We do not have another decade to waste nursing nutters. Action is essential. There is still a need for division of labor, and this website makes a large contribution.
    0 0
  11. DM #1 The longer term trend is statistically significant. The trend is exponential at about 2% per year. Knorr does not suggest otherwise - his paper was about airborne fraction not the the rate of change in CO2 concentration. If you analyse the data by looking at the annual changes (rather than cumulative total, which is the measured data) then you appear to lose statistical significance and risk misleading results due to noise.which is masking the true exponential trend. So it is fair to say "And he’s doing it in the face of a clear upward trend at longer timescales!"
    0 0
  12. Arkadiusz Semczyszak, as usual your point is difficult to discern, beyond a typical 'If it is us, it won't be bad anyway'. You seem to prefer the tiny minority of cherry-picked experts, like J. Everett, whose own website, although providing lots of links to actual data, is lessened by use of the term "alarmists"; his indecision as to whether it is actually warming or cooling; his 'soothing' words about things not being too bad maybe; sources from the Daily Mail, The Telegraph, Lomborg, Morner, John Daly, CO2Science, IceCap, CO2Sceptics, ClimateAudit, SEPP, WarwickHughes and IceAgeNow - with a link to RealClimate as some sort of 'balance'; and his use of the St. Roch/Northwest Passage, 'recovery from the LIA', UHI, Consensus, 70s Cooling 'scare' and Climategate fallacies. The whole thing is a glorified Gish-Gallop, with some credible links thrown in to make it look credible. Even the quote you have from him is as a minority voice in a hearing before the SUBCOMMITTEE ON OCEANS, ATMOSPHERE, FISHERIES, AND COAST GUARD of the COMMITTEE ON COMMERCE, SCIENCE, AND TRANSPORTATION UNITED STATES SENATE ONE HUNDRED ELEVENTH CONGRESS SECOND SESSION APRIL 22, 2010 - a link you should have provided. Out of 33 references to the IPCC, his testimony has 32 of them, including his desire to change the make-up of the IPCC. Obsessed ? As for your link to the NIPCC - that is just laughable, I'm afraid.
    0 0
  13. J. Everett's website, in case anyone is interested.
    0 0
  14. 13, JMurphy, Ick. I clicked it. Now I have to sanitize my mouse button. Really, how can people read such nonsense and (a) not be offended by the misinformation and (b) not be angered that such people (and so many of them) are putting so much effort into selling lies to the unwary but eager-to-believe?
    0 0
  15. mdennison, fair enough! Many thanks for the clarification.
    0 0
  16. Look on the bright side: Admitting that there's a decline in the rate of atmospheric CO2 buildup is at least an admission that it actually is building up. That's a baby step on the road to reality. But seriously, from Joos and Spahni 2008: The 20th century increase in CO2 and its radiative forcing occurred more than an order of magnitude faster than any sustained change during the past 22,000 years. The average rate of increase in the radiative forcing not just from CO2 but from the combination of CO2, CH4, and N2O is larger during the Industrial Era than during any comparable period of at least the past 16,000 years. -- full size For recent years, the analysis by (7) shows that CO2 emission from fossil and industrial sources, the primary driver of anthropogenic climate forcing, have been accelerating over the past few years compared with the 1990s. Note (7) refers to Raupach 2007: CO2 emissions from fossil-fuel burning and industrial processes have been accelerating at a global scale, with their growth rate increasing from 1.1% y−1 for 1990–1999 to >3% y−1 for 2000–2004. No decline there. But looky here, a ray of hope: Global CO2 emissions actually decreased by 0.5 Gt CO2 between 2008 and 2009, which represented a decline of 1.5%. So on the basis of one year (a year of worldwide economic recession and reduced industrial activity), we did indeed have a decline! But one year later, a record 30.6 gigatonnes of carbon dioxide poured into the atmosphere, mainly from burning fossil fuel – a rise of 1.6Gt on 2009, according to [2010] estimates from the IEA regarded as the gold standard for emissions data. Hiding the decline (in rate of increase) was never even a question. It vanished into thin, 394 ppm (the 5/2011 peak reported by Scripps) CO2 air.
    0 0
  17. Muon, Does the decline and then rise in N2O and CH4 between 13k and 11k have something to do with the Younger Dryas?
    0 0
  18. HH#17: "the Younger Dryas?" It certainly appears to be. They show in supplemental information a detail of that anomaly. There's a big jump in methane (up to 800ppb), which settles to a plateau at a higher level (700) than prior to the jump (500). All from GRIP ice core, as are the data depicted here.
    0 0
  19. Re: DM @1 Based simply on this data, you could argue that - the trend in the global ESRL data is significant only at ~93% confidence interval. However, MLO data which stretch back to the late 1950's and are in good agreement with the ESRL data in their overlap, show a significant increase (p~01^-7)
    0 0
  20. Re: JH @2 Sure! Top to bottom, Fig1: Taken from the written statement of Dr. John Everett before Senate EPW hearing on “EPA's Role in Protecting Ocean Health”, May 11, 2010. Fig2: Global CO2 rate data taken from Thomas Conway and Pieter Tans, Annual Mean Carbon Dioxide Growth Rates NOAA/ESRL (www.esrl.noaa.gov/gmd/ccgg/trends/global.html) Fig3: MLO data from Pieter Tans and Ralph Keeling. Mauna Loa Annual Mean Data, NOAA/ESRL/Scripps (ftp://ftp.cmdl.noaa.gov/ccg/co2/trends/co2_annmean_mlo.txt). IS92a Scenario from IS92a CO2 concentrations (http://www.cgd.ucar.edu/vemap/supplemental/IS92a.dat). Dr. Everett's projection (described in his remarks in part II) is based upon the assumption of a constant accumulation rate of 1.87 ppm/year; the extrapolations based on MLO (1959-present) and global (1980-present) rate data are calculated by integrating the least-squares linear fit with the 2009 CO2 concentration as an initial condition. Fig4: IPCC AR4 Working Group I, figure 6.1. (http://www.ipcc.ch/publications_and_data/ar4/wg1/en/ch6s6-3.html) Fig5: MLO data as with Figure 3; all others from the Paleoclimatology archive of NOAA's National Climatic Data Center. Law Dome data were the 75-year smoothed series from Etheridge, D.M., et al., 2001, Law Dome Atmospheric CO2 Data, IGBP PAGES/World Data Center for Paleoclimatology Data Contribution Series #2001-083. NOAA/NGDC Paleoclimatology Program, Boulder CO, USA. (http://www.ncdc.noaa.gov/paleo/metadata/noaa-icecore-2455.html) Taylor dome data were from Indermühle, A., B. Stauffer, T.F. Stocker and M. Wahlen, 1999,Taylor Dome Ice Core CO2 Holocene Data. IGBP PAGES/World Data Center-A for Paleoclimatology Data Contribution Series #1999- 021 NOAA/NGDC Paleoclimatology Program, Boulder CO, USA. (http://www.ncdc.noaa.gov/paleo/metadata/noaa- icecore-2419.html) Vostok data were originally published in Barnola, J.-M., D. Raynaud, Y.S. Korotkevich, C. Lorius. 1987. Vostok ice core provides 160,000-year record of atmospheric CO2. Nature 329:408-414; the data were retrieved from the NCDC archives (http://www.ncdc.noaa.gov/paleo/metadata/noaa-icecore-2442.html). Fig 6: Same data as Figure 5; rates have been calculated by dividing the difference between successive concentrations by the length of time between them, and assigning the resulting rate to the midpoint of the time interval (ie, given a time series [Ti, Xi], a new time series is constructed [ti, Yi] where ti = (Ti + Ti+1)/2 and Yi = (Xi+1 - Xi) / (Ti+1 - Ti))
    0 0
    Moderator Response: [John Hartz] Thanks. The captions should now be inserted into tbe article.
  21. re: 4-6 Ooops! It should in fact be concentration on the Y-axis. That will teach me to copy/paste code :( I'll fix it momentarily.
    0 0
  22. Here's my favorite graph showing "no change". Haven't seen it elsewhere, don't know why.
    0 0
  23. Thanks for an interesting article. Would Figure 6 with a log-linear Y-axis add to the discussion, or do the different sources/smoothing/whatever make this uninformative?
    0 0
  24. Interesting Arkadiusz refers us to a paper that does not support his conclusions. In his subsection from Seki et al 2010 entitl;ed "Changes in the CO2 were also rapidly:", he highlights and describes a part of a figure 9, whose data do not come from Seki et al. In fact, they come from: Raymo et al, 1996. Mid-Pliocene warmth: stronger greenhouse and stronger conveyor. Mar. Micropaleontol. 27 (1–4), 313–326. Here, we see that not only are the errors in the ~370-470ppm pCO2 estimates for the mid-Pliocene given as +/-65ppm on the graph, and suggested +/-25ppm in the text, the most rapid variation is 29ppm over 3600 years, or 66ppm over 31,200 years, with undefined age errors referred to an earlier paper (Shackleton et al 1990), the rate of CO2 drop in the first instance is 0.008ppm/yr, and increase in the second instance is 0.002ppm/yr. Now ignoring the errors discussed in the papers and above, hands up who would like atmospheric CO2 to be increasing by as little as 0.005ppm per year? Not exactly rapid, compared to modern rises several orders of magnitude larger! Arkadiusz, be careful with your sources, and placing your own amateur interpretations of large variations put on a scale where the x-axis reads hundreds of thousands or millions of years...
    0 0
  25. Good article, chukbot. Thanks for debunking one more piece of misconception. I found minor detail worth the correction. In Pedantic Semantics section you say: If the pH of a solution changes from 9 to 8, the solution has acidified, even though it is still basic. IMO, it's more correct to say: If the pH of a solution changes from 9 to 8, the solution has acidified, even though it is still alkaline. I'm not a chemist but I think from primary school that 8 is definitely alkaline, since it's 1 degree above (10 times more alkaline ions) the basic.
    0 0
  26. I took time to read the concluding remarks from Everett's testimony. I don't agree with his arguments about "plasticidity and resilience of affected organisms". The facts are: background extinction rate is just 1 per my. Our current human-induced extinction rate already is 10-100 times higher and as soon as by 2050, we can wipe off some 20-30% of all species as we discussed here. That matches the major extinction events. Does it make sense to boast about "resilience of organisms" up to that point and say that it's still "all right"? We are clearly causing such massive devastation of species diversity and it is good because such thing "happened in the past" (only four times many milions ya)? Even the moral part of that story aside, how can anyone draw a conclusion that "nothing bad happens" if it is repeated now? Another remark from Everett is even more disturbing, because it's simply insane, quote: Despite severe and abrupt ocean climate changes in terms of currents, temperatures, salinity, pH, and other parameters, the biology changes rapidly to the new state in months or a couple years. These changes far exceed the changes expected with human-induced climate change and occur much faster. The estimated 0.1 change in alkalinity since 1750 and the one degree F. temperature rise since 1860 are but noise in this rapidly changing system First of all, Everett confuses climate with weather here when talking about "abrupt changes" in months or couple of years. I assume climate scientist should know the distinction. But the last statement that global warming of 1F from 1860 is "noise in this rapidly changing system" irritates my sense of sanity. If you have high school level knowledge about signal theory, just look at those temp graphs, either BEST or GISS or HAD, you clearly see that this 1F or 0.6C is the trend. Noise is that Everett's "rapidly changing system". And the whole argument does not make sense. Being not an expert in this field, I don't understand why such incoherent rambling can be pronounced by a fellow who works in NOAA and IPCC. And why this rambling can be accepted by Congress as a "testimony". Can someone explain if Everett wanted to say here something sensible or should I be left with an impression that he does not understand what he's talking about?
    0 0
  27. Great article. More people should present data as you have, i.e. in your "historical CO2 trends", and "historical CO2 rate trends" charts which show present trends as vertical lines. On the general subject of ocean acidification, I note that J.E.N. Veron, one of the world's authorities on reefs, has a great book out, "A Reef in Time", which is his plea to the world that the composition of the atmosphere be stabilized so that life in the oceans can be conserved. A few quotes follow. The italics are Veron's: "Acidification is serious because of commitment - a word that will soon be used with increasing frequency in the scientific literature. Commitment embodies the concept of unstoppable inevitability, according to which the nature and health of future environments will be determined not by our actions at some future date but by what is happening today. The oceans, including the ocean depths, respond slowly to atmospheric conditions, whether a temperature increase or a CO2 buildup, which means that the full effects of acidification will take time to develop. Nevertheless, this is only a delay: the factors causing acidification will have irretrievably committed the Earth to the process long before its effects become anywhere near as obvious as those of mass bleaching today." "Ocean acidification must be taken seriously and as a matter of great urgency if the world's oceans are not to be committed to a future of unbridled destruction. It has happened before and it not only can happen again it will happen again unless adequate intergovernmental action is taken on CO2 emissions now. This is one of the most serious (if least well understood) of all predicted environmental changes on Earth, yet so far it has attracted only the most superficial publicity and, to date, only the beginnings of intergovernmental recognition. Preventative action is the same as for global warming and coral bleaching, but the time frame and severity of acidification, as well as its long-term consequences, have no equal." Also: "a lack of international willingness to confront core issues will soon lead to unstoppable processes that could bring on an extinction event the likes of which the world has not seen for 65 milion years". "the effect will, at least in the case of ocean acidification, last for a minimum of hundreds of thousands of years"
    0 0
  28. "It is a difficult idea to fathom. But the science is clear: Unless we change the way we live, the Earth's coral reefs will be utterly destroyed within our children's lifetimes." Source: "Is the End in Sight for The World’s Coral Reefs?" by J.E.N. Vernon, Yale Environment 360, Dec 6, 2010 To access this informative article, click here 0 0
  • Images fixed and captioned! re:23 (Bruce) I have thought about a logarithmic time axis - it would be a neat way of comparing events over different time scales. Unfortunately that collapsing of scales can be a conceptual barrier to people who aren't used to thinking with logarithms. For example, I have shown people this image: and even after explaining that the changes are taking place on very different time scales, they still see the current event as being comparable to the 100myear scale oscillations. It would be neat though. I made some fancy backgrounds for some of my graphs and the one I did for the Vostok/Taylor/Law/MLO concentrations was my favorite. I was reading a lot of HP Lovecraft at the time and especially liked the story At the Mountains of Madness, which is set during a geological research expedition to Antarctica. I based it a lot on how that story felt to me Photobucket
    0 0
  • re 25 (chriskoz): My understanding is that basicity is defined by the concentration of OH- ions in the same way that acidity is defined in terms of the concentration of H+ ions. A solution is basic when its basicity outweights its acidity - that is to say, there are more OH- ions than H+. When this happens, the pH is greater than 7 (7 being the pH of a neutral solution.) One thing that I didn't know about before researching OA is that alkalinity and basicity, which I had previously treated as synonymous, are actually distinct concepts. Acidity, alkalinity, and CO2 are related in the ocean, and the Gazeau 2007 paper I mention used this interrelationship to study the effects of high CO2 on shellfish calcification in a way I thought was clever. So I think that it is fine to describe a pH change from 9 to 8 as acidification of a solution that remains basic. Your discussion in #26 seems right on though :)
    0 0
  • You need to be logged in to post a comment. Login via the left margin or if you're new, register here.


    The Consensus Project Website

    THE ESCALATOR

    (free to republish)


    © Copyright 2024 John Cook
    Home | Translations | About Us | Privacy | Contact Us