


 Arguments
Software
Resources
Comments
The Consensus Project
Translations
About
Support
Arguments
Software
Resources
Comments
The Consensus Project
Translations
About
Support
![]()
![]()
![]()
![]()
![]()
![]()
![]()
![]()
![]()
![]()


![]()


Latest Posts
- Fact brief - Did CO2 contribute to early 20th century warming?
- Update on Texas flooding
- 2025 SkS Weekly Climate Change & Global Warming News Roundup #28
- Skeptical Science New Research for Week #28 2025
- Trump just gave a huge gift to China’s economy
- Fact brief - Is global warming just due to El Niño?
- The great acceleration debate
- 2025 SkS Weekly Climate Change & Global Warming News Roundup #27
- Skeptical Science New Research for Week #27 2025
- Take advantage of these tax credits before Congress kills them
- Fact brief - Are human CO2 emissions driving current global warming?
- What do the latest WMO temperature projections imply for 1.5C?
- 2025 SkS Weekly Climate Change & Global Warming News Roundup #26
- Skeptical Science New Research for Week #26 2025
- You did it! Yale's 2025 extreme weather coverage is funded
- Rebutting 33 False Claims About Solar, Wind, and Electric Vehicles - Recap
- Climate Adam - Silencing Science: Trump's War on Our Climate
- 2025 SkS Weekly Climate Change & Global Warming News Roundup #25
- Fact brief - Is modern warming just a rebound from the Little Ice Age?
- Show your Stripes Day on June 21 2025
- Skeptical Science New Research for Week #25 2025
- The role of aerosol declines in recent warming
- Sabin 33 #33 - What is the effect of hot or cold weather on EVs?
- 10 ways that Trump’s tax bill would undermine his energy promises
- 2025 SkS Weekly Climate Change & Global Warming News Roundup #24
- Fact brief - Was 1934 the hottest year in the global record?
- Skeptical Science New Research for Week #24 2025
- Climate Adam: Is China Finally Changing Its Climate Ways?
- Sabin 33 #32 - Is range restriction a problem for EVs?
- The Trump EPA tried to bury some good news
Comment Search Results
Search for Pacific Decadal Oscillation
Comments matching the search Pacific Decadal Oscillation:
- Arctic icemelt is a natural cycle
MA Rodger at 20:04 PM on 23 October, 2022stranger1548 @76,
The climate system is a complex beast and because of this it is possible to have issues like the Arctic climate change where there are not just contradictory findings yet-to-be-resolved, but also apparently contradictory findings but which, when examined in detail, are not actually contradictory but looking at slightly different aspects of the same thing.
Thus the 'Intermediate' OP here quotes Notz & Marotzke (2012) 'Observations reveal external driver for Arctic sea-ice retreat' which says there is no correlation between PDO & Arctic SIE while, for instance, this 2016 CarbonBrief post by Screen & Francis says the PDO does impact the Arctic warming.
But digging into the research, Notz & Marotzke are looking at long-term trends in summer Arctic SIE while Screen & Francis (2016) 'Contribution of sea-ice loss to Arctic amplification is regulated by Pacific Ocean decadal variability' are looking at oscillations (so not long-term trends) and winter Arctic climate (so not summer) and are interested in the winter Arctic temperatures and how the PDO impacts temperature at differening SIE levels.
That is not to say that there are contradictory findings in the literature, but if there are such findings they need to be addressed on a paper-by-paper basis.
- The silver lining of fake news
dkeierleber at 03:27 AM on 30 August, 2018I think this is being oversimplified. It’s a complex issue. It is enticing to dismiss those who mistrust science as being uneducated on the subject. But that leads us to the same dead end of thinking all we have to do is tell the real facts and people will come around to the right way of thinking. Research doesn’t support that view.
As reported here in the past, regarding climate change, the more educated a conservative is the less likely they are to be persuaded by facts. Presentation of science facts drives deniers further into denial. So I don’t think the problem lies with denialist falsehoods. In my experience, climate change denialists are in love with the lamest over-simplifications. How often have you read the comment about how temperatures could have risen in the past if the cavemen had no SUVs to drive? Ever hear any denialist try to use Roy Spencer’s argument about natural variation tied to the Pacific multi-decadal oscillation?
Things are even worse on the economic front. Workers who have been profoundly hurt by supply side fiction insist that the wealthy pay too much in taxes. Educated upper middle class conservatives think the top tax rate in America’s Golden Age (the 2 decades after WWII) was 20%. Trying to explain the idea of a progressive tax to young conservatives shows how our education system has changed over the years. We were too distracted by defending evolution in public education to notice that the curricula on basic economic theory took a wrong turn somewhere. Now it seems the age old divide between property rights and majority rule is becoming an economic war and the rich are winning. That doesn’t bode well for the sanctity of our democracy.
Research has shown physical differences in brain patterns between conservatives and liberals. So part of the problem is that some of us tend to believe those in positions of authority while others tend to ask how they rose to that position.
- Sea level rise predictions are exaggerated
NorrisM at 09:47 AM on 1 April, 2018Bob Loblaw, Eclectic and michael sweet,
This has been an interesting journey, exploring what I will describe as the “conflicting views” on the future sea level rise “predicted” for the remainder of the 21st century. Let me say that I appreciate that my use of the term “predict” is used in a general sense and that many of what I refer to as “predictions” are in fact “projections” because they are predictions based upon certain assumptions relating to a number of things but most importantly, the level of CO2 emissions based upon the various pathways assumed by the IPCC.
The relevance of the views of a lawyer are on such a technical subject as “sea level rise” is certainly questionable but I suspect the interest of Bob Loblaw is simply because there are a number of legal cases that will be coming before the courts of the United States over the next few years and these cases will be adjudicated by lawyers and not physicists or other scientists. Having said that, there are many lawyers who have an engineering or scientific background before entering law so there may be some hope of having a scientist hear the case. In my case, my undergraduate degree was in the “dismal science”.
In researching this topic, I have largely focused on Chapter 13 of the IPCC Fifth Assessment (Fifth Assessment) and those portions of Chapter 3 dealing with sea level rise as well as blog information contained on this website on the subject as well as blog information on one other website (which does not carry much weight from most of the commentators on this website). I have also read the US Climate Science Special Report published in late 2017 (US Climate Report) as well as the very good RealClimate article on the Fifth Assessment (suggested by Bob Loblaw).
But before I delve into my impressions from these sources, I would also like to reference the discussion of “uncertainty” both in the Fifth Assessment and the US Climate Report. In both reports, the extent of understanding (and certainty or uncertainty about that understanding) is based upon levels of confidence (dealing with the consistency of the evidence and degree of agreement within the literature) and likelihood expressed probabilistically (based upon the degree of understanding or knowledge).
What I want to focus on are the levels of “Confidence”:
“Medium Confidence” means suggestive evidence (a few sources, limited consistency), competing schools of thought.
“High Confidence” means moderate evidence (some sources, some consistency) medium consensus
“Very High Confidence” means strong evidence (established theory, multiple sources) high consensus.
All of the definitions for uncertainty are found in the US Climate Report in the “Guide to this Report” which is easily located.
I think it is very important to keep these measurements in mind when analyzing the findings of the Fifth Assessment. When they use “Medium Confidence” they do not mean “medium consensus” because that term is reserved for “High Confidence”. Unless the term “Very High Confidence” is used then there is considerable uncertainty remaining.
So to commence this research the most logical place to begin is the Fifth Assessment projections found at Section 3.7.6:
"It is very likely that the global mean rate was 1.7 [1.5 to 1.9] mm yr–1 between 1901 and 2010 for a total sea level rise of 0.19 [0.17 to 0.21] m. Between 1993 and 2010, the rate was very likely higher at 3.2 [2.8 to 3.6] mm yr–1; similarly high rates likely occurred between 1920 and 1950."
Figure 3.14 of the Fifth Assessment shows the “bump” in sea level rates in the period 1920 to 1950. Given that the accepted view is that the rapid increase in the use of GWG’s only started after 1950, it seems incumbent on scientists to explain the “bump”. The only explanation I could find in the Fifth Assessment was that this “bump” was ”likely related to multi-decadal variability”. See Section 3.7.4. However, the natural question is if “multi-decadal variability” caused the increase in rates in the 1920-1950 period then why cannot the increase in rates found since 1993 of approximately 3.2 mm/yr also be attributed to multi-decadal variability? Or should not at least a portion be attributed to this internal variability, if only a portion, then how much?
So the Fifth Assessment found that it was “very likely” (read 90-100%) that the average rate of sea level rise since 1901 was 1.7 mm/yr. But before we get into the 3.2 mm/yr rate, we now have a number of papers since the Fifth Assessment that have suggested that the Fifth Assessment’s 90-100% assured estimate is all wrong and the real rate for 1901 to 1990 is 1.1 to 1.2 mm/yr. (Hay 2015 Dangendorf 2017). When asked by others how the IPCC could have got this so wrong, the answer seems to be that everyone is entitled to be wrong, that is science. I fully agree but it does not necessarily engender confidence in other “Very Likely” predictions or projections of the IPCC in the Fifth Assessment.
Perhaps the IPCC will, in the Sixth Assessment actually maintain its 1.7 mm/yr rate which I understand was similar to the AR4. Why do I say this? Because my understanding is that these “new” lower estimates are largely based upon a reanalysis of VLM. But here is what the Fifth Assessment has to say about VLM adjustments:
"High agreement between studies with and without corrections for vertical land motion suggests that it is very unlikely that estimates of the global average rate of sea level change are significantly biased owing to vertical land motion that has been unaccounted for. {3.7.2, 3.7.3, Table 3.1, Figures 3.12, 3.13, 3.14}"
So now on to the $64,000 question as to whether the observed acceleration in sea level rise since 1993 is an increase in the long term rate or is reflective of decadal variability or only reflects “apples and oranges” measurement issues with satellite altimetry compared to tide gauges.
We have disagreements both on the rate of acceleration and the causes of the acceleration.
Firstly, we have a disagreement between the Fifth Assessment estimates of what the acceleration rate is and the recent Nerem 2018 paper. From the Fifth Assessment, the acceleration is quite small with Ray & Douglas (2011) at -.002 to .002 mm/y, Jeverejeva (2008) at .012 mm/yr and Church & White (2011) at .012 mm/yr. Then we have Nerem (2018) re-evaluating things and coming up with .084 mm/yr. I do not propose to get into the technical disagreements that I have read on the Nerem (2018) paper but even extrapolating his acceleration, his projected 2100 sea level rise is somewhere around 65 cm close to the low range of the IPCC RCP8.5 estimate. Although I am not qualified to make any judgments, I suggest that anyone who is qualified should at least read the comments made by FrankClimate on the other website under the Part IV discussion on sea level acceleration. Without question, FrankClimate is technical. His comments have now been incorporated into the Part IV discussion. Would be interested to hear from Eclectic as to whether he disagrees with FrankClimate.
Secondly, we have questions of what is the cause of this recent acceleration since 1993. I had to ask myself why 1993 and not 1990? The obvious answer is that it is in 1993 that satellite altimetry came into the equation with the launch of the TOPEX satellite. Although I think there is general agreement that there are serious questions about whether the data from TOPEX for the first six years should be used at all (or for that matter even the remaining period for that satellite), my sense from looking at the NASA website is that the satellite altimetry is pretty well matching the tide gauges. I think there are a number of people who disagree with me on this but the average rates seem to match. But it is curious that where we see this very large increase in SLR is not at the land-based tide gauges but out in the middle of the oceans. It at least led me to ask myself whether this significant difference between the tide gauge measurements and satellite altimetry measurements in the middle of the oceans would have always been there if we could have measure it with satellites much earlier. I fully appreciate that the tide gauge measurements have shown an upward trend since 1980 (Section 3.7.4) but my understanding is that the large average increase during the satellite era can be attributed to the large increases found in the middle of some of the oceans, especially the Indian Ocean.
But back to attribution. A number of authors have suggested that the way to reconcile the “bump” in 1920-1950 and the increases since 1990 is to link these climate changes to multi-decadal variability, and specifically the AMO or the PDO. Here is what the Fifth Assessment has to say about this at 3.7.4:
"Several studies have suggested these variations may be linked to climate fluctuations like the Atlantic Multi-decadal Oscillation (AMO) and/or Pacific Decadal Oscillation (PDO, Box 2.5) (Holgate, 2007; Jevrejeva et al., 2008; Chambers et al., 2012), but these results are not conclusive."
Others have said that the increase in SLR since 1990 is not “statistically relevant” when looking at the long term sea level rise. In that respect, the Fifth Assessment does make the following statement immediately following the above quotation:
"While technically correct that these multi-decadal changes represent acceleration/deceleration of sea level, they should not be interpreted as change in the longer-term rate of sea level rise, as a time series longer than the variability is required to detect those trends."
For those who say that the acceleration should be attributed to AGW, they largely point to the increased rates of melting in the glaciers and the Greenland ice sheet and potentially catastrophic impacts relating to the West Antarctic Ice Sheet (WAIS). I cannot obviously get into discussing these topics without clearly being “snipped” for too long a post. In my view, having read the Fifth Assessment, the risk of “dynamic changes” in WAIS (there is virtually no risk with the topography of Greenland bedrock) are minimal. Here is what the Fifth Assessment has to say about the MISI hypothesis relating to WAIS at 13.4.4.3:
"In summary, ice-dynamics theory, numerical simulations, and paleo records indicate that the existence of a marine-ice sheet instability associated with abrupt and irreversible ice loss from the Antarctic ice sheet is possible in response to climate forcing. However, theoretical considerations, current observations, numerical models, and paleo records currently do not allow a quantification of the timing of the onset of such an instability or of the magnitude of its multi-century contribution."
As to the evidence of a retreat of WAIS, see Chapter 13 at 13.5.4.1:
"Although the model used by Huybrechts et al. (2011) is in principle capable of capturing grounding line motion of marine ice sheets (see Box 13.2), low confidence is assigned to the model’s ability to capture the associated time scale and the perturbation required to initiate a retreat (Pattyn et al., 2013)."
What this tells me is that there is a “theoretical” danger but so far we do not have any evidence of an actual retreat or the time frame over which this could occur. We cannot base our rational responses to AGW based upon theories which have not been supported with observational evidence.
As for the Greenland ice sheet, we know that the major warming was caused by warm waters appearing around Greenland and the impact that this has had on the melting of the ice sheet in the peripheries around the ocean at least from 1990 to 2012. My understanding is that this has been attributed to a decrease in cloudiness associated with the NAO which would mean that it was the increased insolation which caused the increase in the melting. Here is the discussion in FAQ 13.2 regarding the Greenland ice sheet:
"Although the observed response of outlet glaciers is both complex and highly variable, iceberg calving from many of Greenland’s major outlet glaciers has increased substantially over the last decade and constitutes an appreciable additional mass loss. This seems to be related to the intrusion of warm water into the coastal seas around Greenland, but it is not clear whether this phenomenon is related to inter-decadal variability, such as the North Atlantic Oscillation, or a longer term trend associated with greenhouse gas–induced warming. Projecting its effect on 21st century outflow is therefore difficult, but it does highlight the apparent sensitivity of outflow to ocean warming. The effects of more surface melt water on the lubrication of the ice sheet’s bed, and the ability of warmer ice to deform more easily, may lead to greater rates of flow, but the link to recent increases in outflow is unclear."
With the above information, the question that has been posed to me is where would I place the estimate of GMSL at 2100 compared to the Fifth Assessment (RCP 8.5) projection of .59cm to .98cm?
Firstly, it seems to me that during the 20th Century we had an almost linear rise in sea level as is acknowledged by the Fifth Assessment at 13.3.6 at p. 1159:
"GMSL rise during the 20th century can be accounted for within uncertainties, including the observation that the linear trend of GMSL rise during the last 50 years is little larger than for the 20th century, despite the increasing anthropogenic forcing (Gregory et al., 2013b)."
Here is a larger quote from the same Gregory paper:
“The largest contribution to GMSLR during the twentieth century was from glaciers, and its rate was no greater in the second half than in the first half of the century, despite the climatic warming during the century. Of the contributions to our budget of GMSLR, only thermal expansion shows a tendency for increasing rate as the magnitude of anthropogenic global climate change increases, and this tendency has been weakened by natural volcanic forcing. Greenland ice sheet contribution relates more to regional climate variability than to global climate change; and the residual, attributed to the Antarctic ice sheet, has no significant time dependence. The implication of our closure of the budget is that a relationship between global climate change and the rate of GMSLR is weak or absent in the twentieth century. The lack of a strong relationship is consistent with the evidence from the tide gauge datasets, whose authors find acceleration of GMSLR during the twentieth century to be either insignificant or small.”
This is consistent with the “Munk enigma” that he saw a near linear increase in GMSL during the 20th Century notwithstanding the impact of AGW only in the second half.
The Fifth Assessment RCP 8.5 assumes that in the second half of the 21st Century we will have what at least are “quadratic increases” if not “exponential increases” in the GMSL rate. I have no understanding of how a “quadratic curve” differs from an “exponential curve” and I do not have to notwithstanding all of the debate that I read on this issue on the “other website”. What I do know is that it is much steeper than a linear increase.
From Table 13.5 the Fifth Assessment has acknowledged that in the case of RCP 8.5 that in the period 2018 to 2100 they project an average sea level rate of 11.2 mm/yr for the mid-case and for the high case of .98 m the projected average rate is 15.7 mm/yr. See Section 13.5.1 at page 1180:
"The rate of rise becomes roughly constant in RCP4.5 and RCP6.0 by the end of the century, whereas acceleration continues throughout the century in RCP8.5, reaching 11 [8 to 16] mm yr–1 in 2081–2100."
Notwithstanding this projection, the Fifth Assessment acknowledges that this would exceed the average rate of 10 mm/yr during the deglaciation after the Last Glacial Maximum when there were massive ice caps over North America and Europe and Asia to supply the melt water (Chp13 pg. 1205):
"For the RCP8.5 scenario, the projected rate of GMSL rise by the end of the 21st century will approach average rates experienced during the deglaciation of the Earth after the Last Glacial Maximum."
The IPCC clearly understood this but did not explain how this could be achieved given the lack of such volumes of ice now (Chp 13 pg. 1185):
"The third approach uses paleo records of sea level change that show that rapid GMSL rise has occurred during glacial terminations, at rates that averaged about 10 mm yr–1 over centuries, with at least one instance (Meltwater Pulse 1A) that exceeded 40 mm yr–1 (Section 5.6.3), but this rise was primarily from much larger ice-sheet sources that no longer exist."
Grammatically, the phrase “but this rise ….” modifies the reference to 10 mm/yr and not 40 mm/yr.
The IPCC projection of sea level rise attributes the largest rise to thermal expansion, secondly to glaciers, and thirdly to the Greenland ice sheet mass balance loss and with a negative contribution by the Antarctic ice sheet.
As to the IPCC’s ability to adequately model dynamic changes to the Greenland and Antarctic ice sheets here is what the Fifth Assessment says at 13.5.4.1 pg 1187:
"As discussed in Sections 13.4.3.2 and 13.4.4.2, there is medium confidence in the ability of coupled ice sheet–climate models to project sea level contributions from dynamic ice-sheet changes in Greenland and Antarctica for the 21st century. In Greenland, dynamic mass loss is limited by topographically defined outlets regions."
Note the use of the term "Medium Confidence".
With all of the above research, given that I could not accept some of the projections of the IPCC for RCP8.5 (leaving alone the fact that RCP 8.5 is probably unrealistic given the changes we see in a move to renewable energy sources at least in the developed world) the question came down to what would I guesstimate the GMSL for 2100 if for some reason I was asked my opinion (which I was by Bob Loblaw).
For me, I would go back to the observations and look at where the sea level has moved since 1900 and assume that it will follow along the same largely linear path that it has pretty well followed since we have kept records in tide gauges. Taking Figure 13.27 of the Fifth Assessment and applying a ruler to the line, it projects out to about .4m by 2100. In other words, whatever impact CO2 emissions have had they are “baked in the cake”. What we see is what we will get.
Using the most recent date online at NASA, as of December 2017, we have had an 87.5 mm rise since 1993 representing an average rate of 3.2 mm/yr according to the NASA website. If we multiply this figure of 3.2 mm times 82 years, we arrive at around 26.24 cm of further rise if the rise continues to be linear. If you add this 26.24 to the .19 cm for the period 1900 to 1990 it totals 45.24 cm.
So my guess is that we probably will have a further 21 to 26 cm from now until 2100 representing somewhere around 8 to 10 inches of sea level rise. Unfortunately, I will not be around to see if I am right!
- Battered by extreme weather, Americans are more worried about climate change
nigelj at 10:59 AM on 21 November, 2017Tom @3
1) The line representing the natural variations shows no increase for the 2015/2016 el nino,
It doesn't show 2015 el nino spike, and any other el nino. This is probably because El nino / la nina is a repeating very short term cycle, that doesnt show a long term trend upwards or downwards. Its flat in other words on time scales more than a decade.
"2) The line representing the natural variations shows no warming for the warming side of the pdo/amo cycle which was generally credited from the early 1980's through the late 1990's,"
It doesnt show pdo warming, or cooling side either, because its a roughly 20 year cycle upwards and downwards so not driving longer term trends. Its also not big causal factor in warming, its affects are complicated, and trend was peaking in 1980 and falling gradually after 1980. See article below.
www.skepticalscience.com/Pacific-Decadal-Oscillation.htm
"3) the line representing the natural variations shows no effect for the emergence from the little ice age,"
Thats because theres no such effect. An emergence is just a vague word, not something quantified.
"4) The line representing the natural variations shows no effect for the long term general increase in solar radiance for the period from 1850 through 2015."
Theres no long term general increase. There was increase in solar irradiance from approx 1920 - 1980 which is reflected in the slight positive slopes in the global warming "index" graph in article over those periods. I'm going from data on solar irradiance here from 'sorce', the official people who compile this as below:
lasp.colorado.edu/home/sorce/files/2011/09/TIM_TSI_Reconstruction-1.png
It's also important to recall effect of solar irradiance changes is much less in watts / m2 than CO2.
"My citation to the two solar radiance links, both of which show a general long term increase in solar radiance are directly on point"
Your citation is someones weather blog, that is unclear on original source on data, and shows two contradictory graphs. The actual real data is as follows from 'Sorce' as I stated above.
- Models are unreliable
SemiChemE at 14:49 PM on 14 March, 2017scaddenp @1019 - I'm afraid you are missing the point. I do not claim that the satellite data set is the best. Rather that only in the satellite era do we have a spacially dense data set adequate for capturing most of the relevant phenomena that must be captured and calibrated in the models.
I'm completely fine with climate scientists using a hybrid record, incorporating surface records, radiosonde data, satellite data, and Ship-based and buoy based observations to make the best data set possible. But, my point is that only in the satellite era has such a data set been possible.
Furthermore, since we are only 40 years into this era, we are barely half-way through a complete Pacific Decadal Oscillation, which appears to be one of the larger sources of natural climate variability. For these reasons, modelers must make assumptions about natural climate variability that may or may not be true. Once we have observed a complete cycle, we'll be in a much better position to verify or refine these assumptions as necessary. This will lead either to improved model verification, which will significantly increase our confidence in the existing models or development of refined models that are much more accurate.
- Models are unreliable
SemiChemE at 14:22 PM on 14 March, 2017Rob Honeycutt @1016 - My understanding is that one of the largest sources of natural climate variability is the Pacific Decadal Oscillation. I am by no means an expert, but my understanding is that this phenomenon has a period of 50-70 years (see wikipedia). As stated before, we are roughly 40 years into the satellite era, so presumably we have observed roughly 2/3's of one cycle with a relatively dense data set (eg. the satellite record). I believe that once we have observed a complete cycle (or perhaps even a bit sooner), our understanding of this major natural process will greatly improve and as a result, our ability to model it properly will also improve. Thus, I'm anticipating a significant advance in the modeling accuracy within the next two decades. Presumably, this will lead to significant improvements in the precision and accuracy of model-based ECS estimates.
Note, I'm not saying that the satellite data set is perfect or the best temperature measurement, but it is the only set with nearly complete coverage of the earth's atmosphere. Thus it is the natural data set for use in calibration and validation of models designed to cover the atmosphere.
- 2017 SkS Weekly Climate Change & Global Warming Digest #5
nigelj at 08:32 AM on 7 February, 2017Blatz @10,
Just one other comment. December was an unusually hot month more so over the oceans than land. This should be apparent looking at the various NOAA maps. However that was just december, and probably reflects the influence of the tail end of el nino ocean phenomenon, in addition to underlying global warming.
We have another different ocean cycle called the pacific interdecadal oscillation that operates on about 30 year time frames. It has been in a negative phase during the period of the so called"pause" and almost certainly contributed to this slowdown. It is likely to switch to a positive phase over the next 10 years. I have seen an article on this, but don't have time to track it down. This will add to the robust greenhouse gas warming we are seeing. It's not going to be great. This is more important than counting the number of weather stations over Africa.
- Humans are too insignificant to affect global climate
Tom Curtis at 12:20 PM on 16 January, 2017Denny @21, as the moderator [PS] indicates, the IPCC AR5 found that in the period 1951-2010, more than 100% of warming was due to anthropogenic factors, as shown in this graph derived from AR5 data by Real Climate:
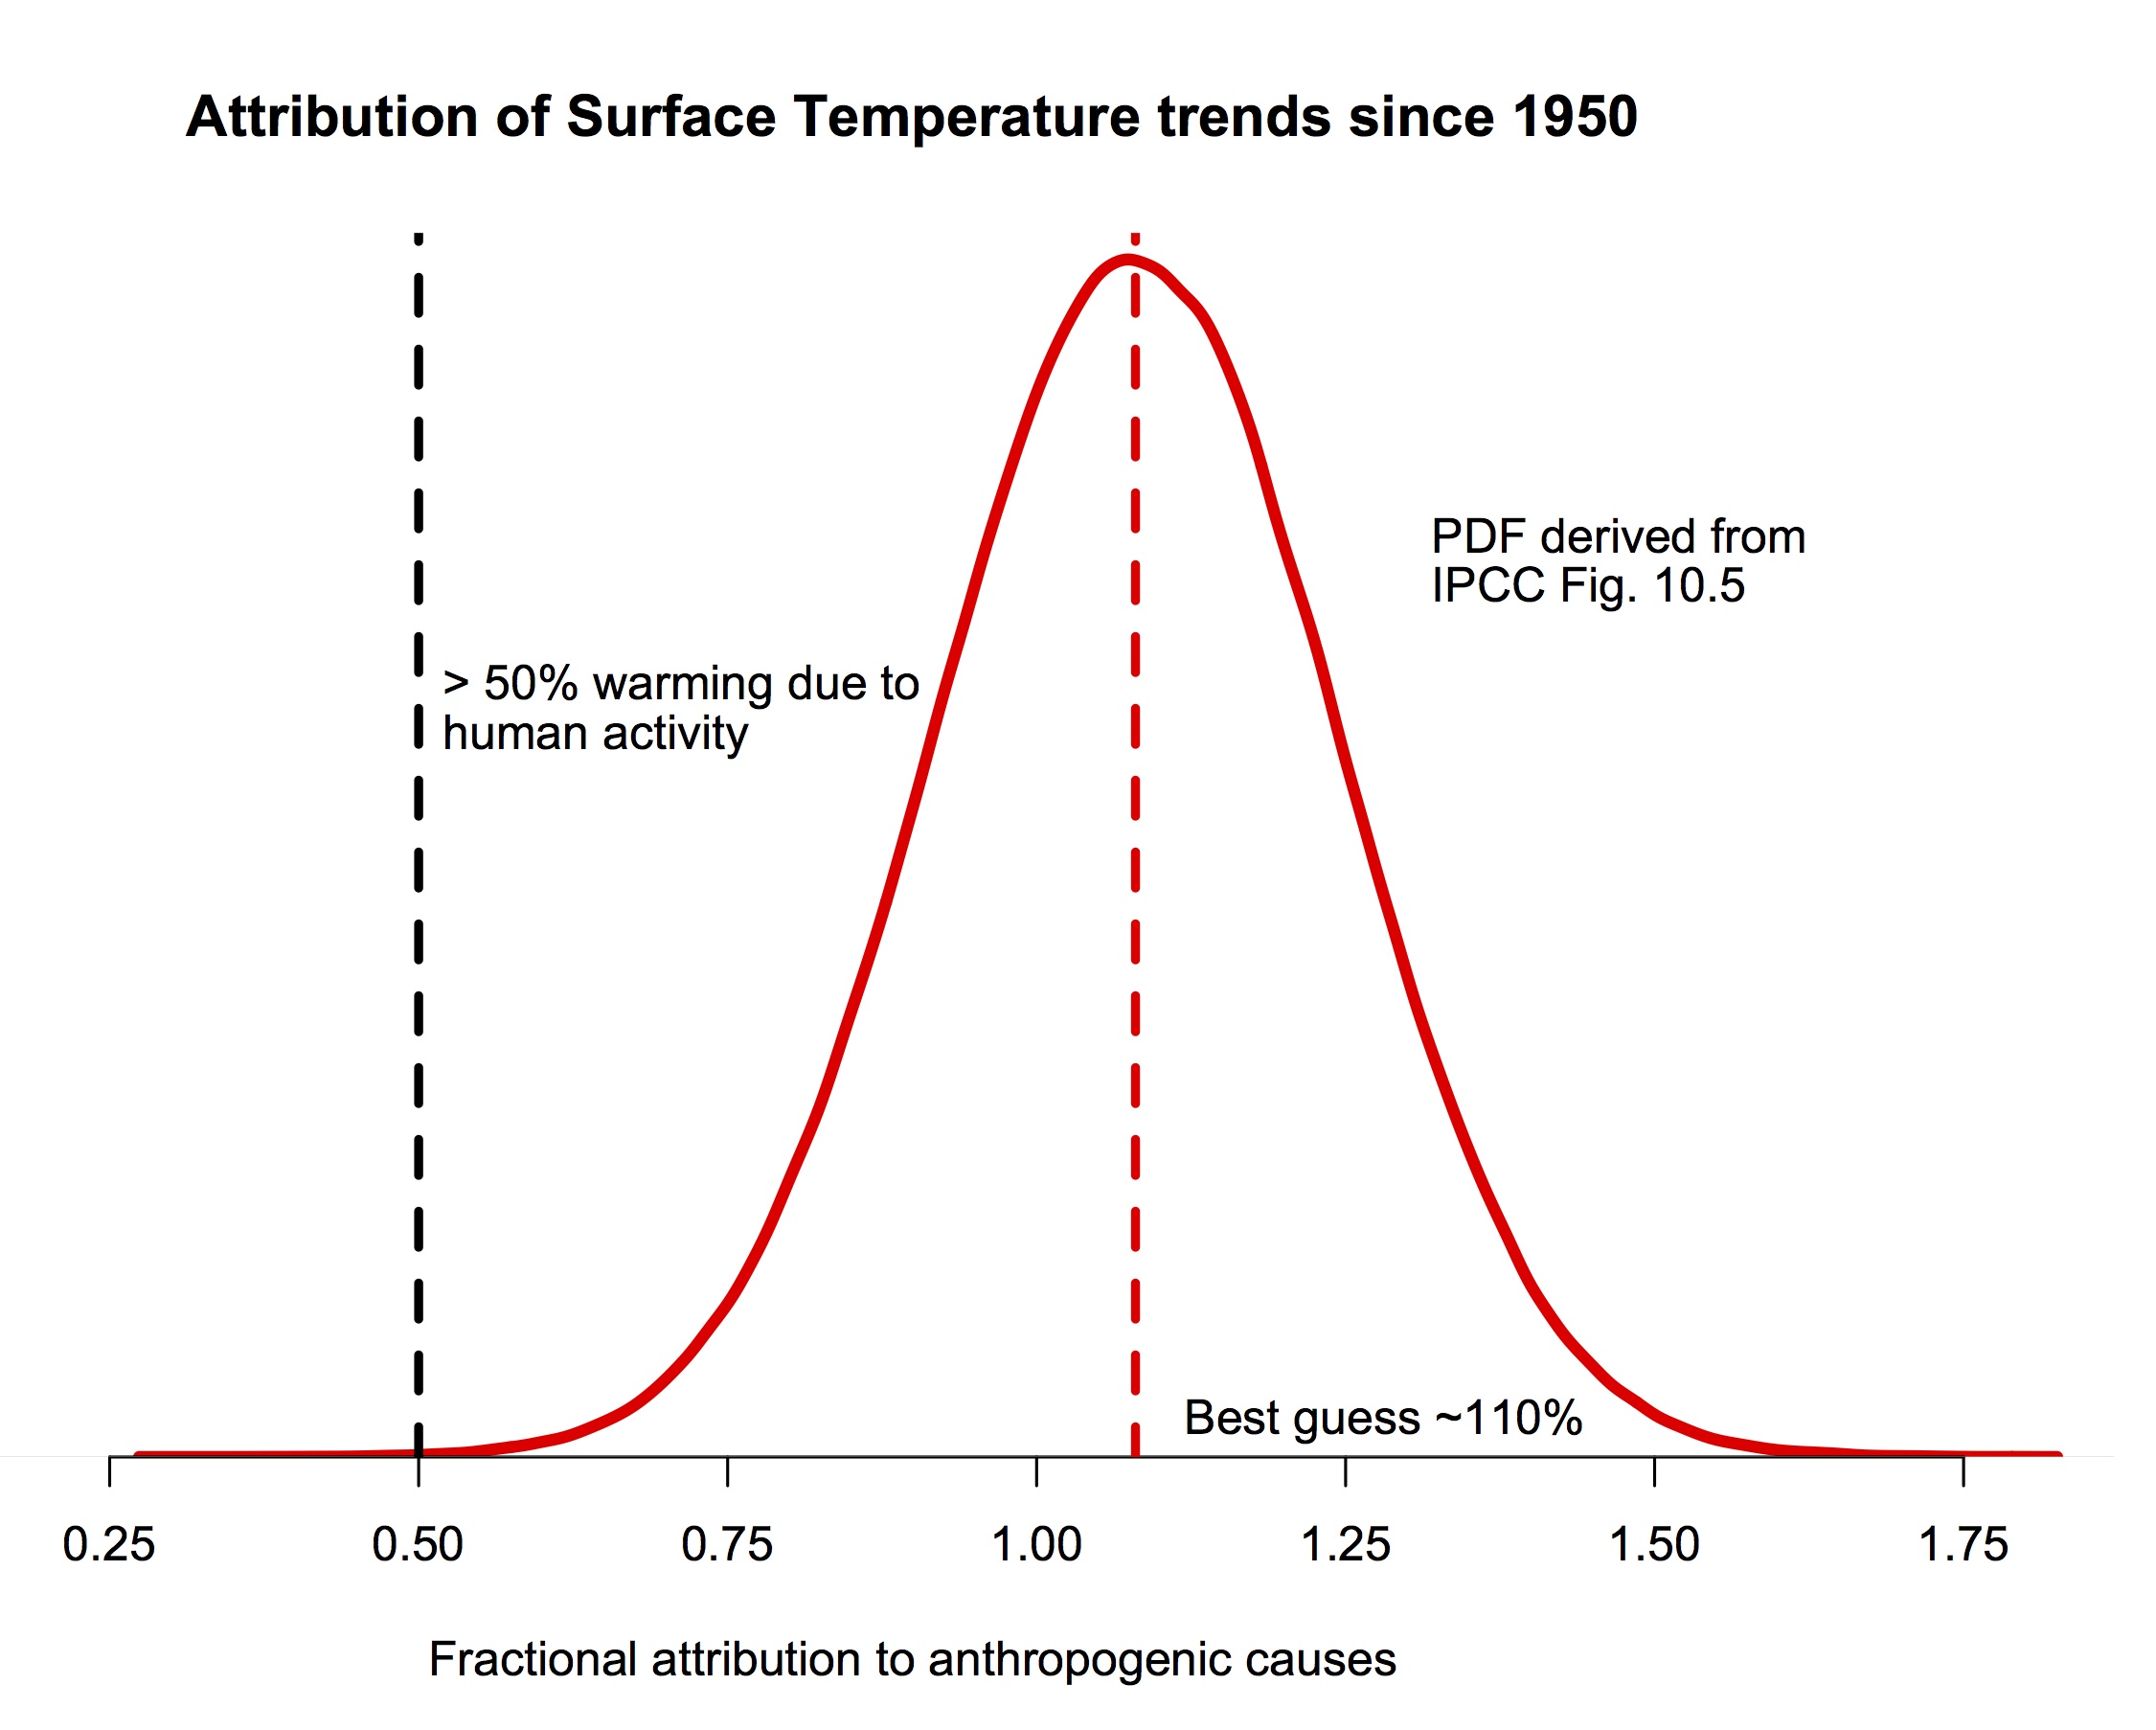
The likelihood that anthropogenic factors caused only 50% or less of the warming is very small (0.06%) based on that graph, while the likelihood that it is less than 100% is only 33.14% - ie, less than one chance in three. The IPCC final statement is more conservative than the graph, allowing a likelihood of not less than 95% ("extremely likely") that the anthropogenic factors caused more than 50% of the warming.
The IPCC can be this confident because the primary natural forcings (solar and volcanic) are known to have had a negative trend over that period; the ENSO influence is known to have been near neutral; and because the sixty year period provides a close coincidence with the period of natural cycles thought by some to have a significant influence on temperaure (AMO, PDO) and hence are neutral, or very nearly so. Other purported natural influences are either also negative because associated with one of the influences above (eg, cosmic rays), or of such poor scientific basis as to be magical thinking. Because of this, denying that the anthropogenic contribution over that period is in the range of (approximately) 75-125% amounts to magical thinking and/or pseudoscience.
What is worse, anthropogenic contribution is not constant over time. It amounted to less than 50% from 1901-1950, and likely around 30%, for example. Taking the 1901-2010 interval, it is closer to 75% than 100%. With ongoing emissions at a Business As Usual rate (RCP8.5), the anthropogenic contribution will become overwhelming. That is, it will still be close to 100%, but the probability of it falling below 75% will become vanishingly small unless something very unusual happens (ie, an increase in solar activity unprecedented in tens of thousands of years (and potentially over the entire life time of Sun to date). Further, because such natural factors are unpredictable, they are not included in the projection, so that if some unprecedented natural warming did occur, so that the anthropogenic contribution fell to 80%, then likely the total warming will have increased to 5 C, not the 4 C projected.
- It's Pacific Decadal Oscillation
John Hartz at 13:02 PM on 26 August, 2016Recommended supplemental reading:
Going out for ice cream: a first date with the Pacific Decadal Oscillation by Tom Di Liberto, NOAA Climate.gov, Aug 25, 2016
- State of the Climate 2015: global warming and El Niño sent records tumbling
nigelj at 07:51 AM on 22 August, 2016Jonbo @69
" I hear 'skeptics' claiming that we are going to soon be entering a cooling phase that is likely to be of long duration due to lower sun activity and changes in ocean cycles."
I'm no expert, just an interested observer of the climate change debate, however I have repeatedly read articles in responsible publications like this saying the effect of solar cycles on temperatures is simply not that large, and not enough to hugely alter the increasing greenhouse affect and IPCC projections of warming going forward.
I also read an article saying that the oceans are basically entering a warming phase according to scientists, that could last several decades at least as below.
This is the PDO (the pacific decadal oscillation) and its been in a cool phase for some years and may have been a factor in the pause since 1998 (slight slow down). The signs are its now entering a warm phase that could be decades long, and will simply add to warming from greenhouse gases, and could counteract any change in solar irradiance . It's certainly a cyclical event so has to change sooner or later. So the sceptics seem to have it 100% wrong and around the wrong way.
- CO2 is not the only driver of climate
Tom Curtis at 18:10 PM on 12 May, 2016Ken Kimura @19, if you sum all forcings (ie, not just that from CO2) using the values estimated by Meinhausen et al (2011), the trend in the forcings from 1940 to 1970 is 0.0003 +/- 0.0007 W/m^2 per annum. That is, it is essentially zero, and may well have been negative. On top of that, there was a substantial El Nino early in the sequence and a La Nina following the volcanic eruption in 1965 which together with the very low trend in forcings may have tipped the temperature record negative.
Having said that, if you look at this model of the ENSO adjusted temperature responce to forcings, you will see to large temperature spikes around 1939 and 1945 that are not accounted for by the model and which also contribute to the negative slope. It is difficult to know that to attribute those spikes to. They may be due to unusually large forcing by Black Carbon during World War 2. They may also be due to an artifact in the temperature record due to the sudden, very large reductions in temperature coverage along with the simultaneious large changes in methods of measuring Sea Surface Temperature brought about by WW2.
What they are not due to is the Pacific Multidecadal Oscillation (which is captured by the ENSO signal) or the Atlantic Multidecadal Oscillation (which does not have a suitable pattern to explain the phenomenon). Nor are they due to a fundamental misunderstanding of the forcings, or the relative effects of natural and anthropogenic forcings. The model I linked to allows you to weight the various forcings, making natural forcings much stronger in effect than anthropogenic forcings if you desire. Any such attempt, however, greatly increases the number of temperature discrepancies. That fact shows conclusively that theories that attempt to explain the twentieth century temperature record without anthropogenic factors being the dominant factor post 1940 (and a significant factor prior to 1940) are doomed to failure.
- Corals are resilient to bleaching
Rob Painting at 19:28 PM on 26 April, 2016See the 2nd peer-reviewed paper linked to above - the stronger trade winds during La Nina push more warm tropical water westward between the Indonesian archipelago & Australia (the Indonesian Throughflow or ITF).
The 2010-2011 La Nina coincided with an anomalously strong southward Leeuwin Current (normally weak over summer) and weak southerly winds which flow in opposition to the Leeuwin Current.
We appear to be in the positive phase of the Interdecadal Pacific Oscillation (IPO) which should reduce the volume of warm water transported through the ITF, but on the other hand the oceans are growing warmer. A La Nina forecast to develop later this year could prove interesting come next summer.
Anyway, to give you a quick example, here's a composite of sea surface temperatures for La Nina summers excluding the exceptional La Nina of 2011:
- Antarctica is gaining ice
Glenn Tamblyn at 11:07 AM on 3 March, 2016B14
" don't we have two separate causes?" Yep. Maybe more than 2.
Sea Ice has increased a little in the last few years although mainly at the maximum in winter. This year, at the summer minimum it is rather low. Drivers of sea ice extent? Possible changes in sea water salinity, changing the freezing point of the water. Changes in the winds around Antarctica, driving more spreading of the ice and freezing over of the open water created. The wind patterns may have changed due to a combination of the current Pacific Decadal Oscillation which has now started changing, and the ozone hole allowing more sunlight to reach the surface rather than being absorbed in the stratosphere; the extra energy from this may have accelerated the winds.
In Antarctica land ice doesn't melt much - it is too cold. Rather it flows slowly to the coast and eventually breaks off as icebergs. Factors changing this? Ice sheet breakup. Floating ice sheets (not seasonal sea ice) act as buttresses, slowing the speed with which land ice can flow. Some have broken up. Grounding line retreat. This applies particularly in West Antarctica where the 'land ice' is actually sitting on the sea floor 100's and even 1-2000 meters below sea level. Sea water intrusion at the grounding line is causing some retreat of the grounding line, so that ice that was grounded ends up floating, and easier for icebergs to break off. The key here is what is happening to sea water temperatures at the base of these sheets, 100's of meters down. This in turn can depend on differences in what is happening to different currents at different depths.
Some recent research also suggests there is a critical threshold wrt the height of ice cliffs. It seems ice when it contains cracks isn't strong enough to allow ice cliffs to rise much more than 100 meters above sea level. Otherwise it breaks off. Then buoyancy of the remaining submerged ice can then break that off from the main ice cap.
Ice is way more complicated than just melting and freezing. - 10 Indicators of a Human Fingerprint on Climate Change
Tom Curtis at 01:49 AM on 3 February, 2016POJO @92 and @94, seems intent on creating a fiction about the IPCC discussions of DTR. According to his mythology, the IPCC supported "the DTR story" up to, and including the Third Assessment Report (TAR), but thereafter withdrew that support. In fact, the IPCC discussion of DTR has been nuanced throughout. This, from the First Assessment Report (FAR) we have:
"Because the ocean has a large heat capacity, diurnal temperature variations in the ocean and in the overlying air are considerably muted compared with those over land and, from a climatic point of view, are likely to change little Over land, diurnal variations are much less restricted so the potential for relative variations in maximum and minimum temperature is much larger Such relative changes might result from changes in cloudiness, humidity, atmospheric circulation patterns windincss or even the amount of moisture in the ground Unfortunately, it is not yet possible to assess variations of maximum and minimum temperature on a hemispheric or global scale However in the regions discussed below, multi-decadal tiends of day-time and night-time temperatuies have been studied and do not always appear to be the same"
Discussion clearly focusses on the multiple possible causes of changes in DTR, and notes that hemispheric and global data is not availabe. From that it follows that they cannot have been pushing "the story" POJO attributes to them.
The Third Assessment Report concludes its discussion of DTR by saying:
"Minimum temperature for both hemispheres increased abruptly in the late 1970s, coincident with an apparent change in the character of the El Niño-Southern Oscillation (ENSO) phenomenon, giving persistently warmer sea temperatures in the tropical central and east Pacific (see Section 2.6.2). Seasonally, the strongest changes in the DTR were in the boreal winter (−0.13°C/decade for rural stations) and the smallest changes were during boreal summer (−0.065°C/decade), indicating some seasonality in the changes. Preliminary extensions of the Easterling et al. (1997) analysis to 1997 show that the declining trends in DTR have continued in much of North America and Asia.
Figure 2.3 shows the relationship between cloudiness and the DTR for a number of regions where long-term cloud cover data are available (Dai et al., 1997a). For each region there was an increase in cloud cover over the 20th century and generally a decrease in DTR. In some instances the correlation between annual cloud cover and annual DTR is remarkably strong, suggesting a distinct relationship between cloud cover and DTR. This would be expected since cloud dampens the diurnal cycle of radiation balance at the surface. Anthropogenically-caused increases in tropospheric aerosol loadings have been implicated in some of these cloud cover changes, while the aerosols themselves can cause small changes in DTR without cloud changes (Hansen et al., 1998 and Chapter 6)."
The strong trend in DTR from the 1970s is attributed to a change in the ENSO regime. The effect of cloudiness is discussed extensively, and some attention is also given to aerosols. Again we have the nuanced discussion we expect from the IPCC.
In short, the only thing that has changed in the IPCC accounts prior to AR4, and after is the addition of more data allowing a better characterization of the trends and uncertainties.
- It's El Niño
Tom Dayton at 03:04 AM on 1 June, 2015Don Sage, for more insight to the errors (and "errors"--ahem) in Don Easterbrook's claims, see Dana's other Easterbrook post, "It's PDO," "It's the Sun," and "Climate's Changed Before." Many Skeptical Science posts have Basic, Intermediate, and Advanced tabbed panes; read them all. Also, be sure to post comments only on the relevant threads. You can monitor all comments on all threads by clicking the "Comments" link in the horizontal blue bar at the top of every page.
- Making sense of the slowdown in global surface warming
KeefeandAmanda at 20:03 PM on 27 May, 2015The article above mentions Steinman, Mann, and Miller (2015), but does not explicitly mention what I think is one of their most interesting contributions to the idea of multidecadal *internal* (rather than external) variability, which is the multidecadal NMO, which is more general than either the AMO or the PMO and thus I think should be the focus rather than either the AMO or PMO. (The PMO and NMO are explained further below.) The article links to the abstract of the paper (which requires payment to read), but does not link to that summary Mann wrote which contains a nice graph of the NMO for all to see. See here
http://www.realclimate.org/index.php/archives/2015/02/climate-oscillations-and-the-global-warming-faux-pause/
for a good summary by Mann, this summary found also at the Huffington Post and Ecowatch sites. This article giving a nice graph of the NMO, and here is a link to the graph:
http://images.huffingtonpost.com/2015-02-12-Sci15FigHuffPost.pngAs for the PMO and NMO: Mann says, "We focused on the Northern Hemisphere and the role played by two climate oscillations known as the Atlantic Multidecadal Oscillation or "AMO" (a term I coined back in 2000, as recounted in my book The Hockey Stick and the Climate Wars) and the so-called Pacific Decadal Oscillation or "PDO" (we a use a slightly different term-Pacific Multidecadal Oscillation or "PMO" to refer to the longer-term features of this apparent oscillation). The oscillation in Northern Hemisphere average temperatures (which we term the Northern Hemisphere Multidecadal Oscillation or "NMO") is found to result from a combination of the AMO and PMO.
Here is a very recent study the article above did not mention, A. Dai, Fyfe, Xie, and X. Dai (2015):
"Decadal modulation of global surface temperature by internal climate variability"
http://www.nature.com/nclimate/journal/v5/n6/full/nclimate2605.html
This article below contains quotes from the authors:
"Scripps Study Explains Recent Pause in Global Warming"
http://timesofsandiego.com/tech/2015/04/18/scripps-study-explains-recent-pause-in-global-warming/
Quotes:
"A National Science Foundation-supported study co-authored by Shang-Ping Xie, a climate scientist at Scripps Institution of Oceanography, UC San Diego, attributes nearly the entire difference between observations and simulations to a climate cycle known as the Inter-decadal Pacific Oscillation (IPO)........"The new study extends this earlier modeling study by relying on observations that go back to 1920," said Xie, "We show that over nearly 100 years, the observed deviations in global mean temperature from the anthropogenically forced climate response are nearly all due to IPO."....... "Recent history suggests that the IPO could reverse course soon. Should that happen, we may see accelerated global warming rates in the coming decades," said Dai." - Making sense of the slowdown in global surface warming
_rand15_ at 10:28 AM on 27 May, 2015@scaddenp: "You might also like to run EXACTLY the same curve-fitting analysis, (quadratic and 2 sine) but with say monthly Dow-Jones average and see how good the fit is."
That would be interesting, wouldn't it? I recall from many years ago that someone published an analysis of extinctions (of species) that purported to identify a particular periodicity. I think it was around 55 million years, if memory serves. The method was fairly complex, and of course the data was pretty sketchy.
Some years later, someone else tried repeating the work, and found that when fed any pseudo data that looked roughly like the real ones, even data with some other periodicity, that the original method always cranked out that 55 million year periodicity. Somehow the method just baked it in. I remember reading the second paper with a lot of enjoyment.
In this case, it's easy to show in several ways that there's a lot of power at the 66-year period, so whatever the reason for it, I'm confident it's really there. Is it "real", in the sense that somehow heat actually is sloshing around in the oceans with that period? II would seem to be generically plausible. ENSO has heat sloshing around with periods of a year or a few years. The PDO and AMO (Pacific Decadal Oscillation and Atlantic Multidecadal Oscillation) seem to be accepted phenomena, and they are generally speaking the right kind of thing (whatever may be driving them). The current indices of the PDO don't correlate too closely with the temperature anomaly record. The AMO correlates better, if I recall correctly from looking at it last year. (Actually, these indices are arrived at by subtracting off some version of the temperature trend from the data, then doing some variation of a principal component analysis. So using them to support the idea of a long-period heat sloshing may seem like a bit of circular reasoning, but at least I'm not the only one).
- The climate 'hiatus' doesn’t take the heat off global warming
ryland at 04:24 AM on 30 April, 2015Professor England says
"As a result, surface temperature is strongly affected by natural variability. Beyond year-to-year variability such as El Niño there are decade-to-decade changes, such as the Interdecadal Pacific Oscillation, which has been shown to have a marked impact on global temperature rise.
In particular the negative phase of the Interdecadal Pacific Oscillation can lead to dramatically increased trade winds and fewer El Niños – as has been occurring since 2001. The modulation of these processes can significantly impact global average temperatures".
This suggests that factors other than human activity have an effect on global temperatures. But what percentage of global atmospheric temperature/ocean temperature change is due to natural factors and what to human activity? Without knowing this how can the extent of the appropriate action be taken to limit huan impact be determined with any degree of accuracy? And why is the sea temperature given in joules rather than in degrees C or conversely why is surface temperature given in degrees C rather than joules? And can ocean temperatures be accurately measured to fractions of a degree or to 100 or so zeta joules?
- Climate researcher Bart Strengers wins wager with climate sceptic Hans Labohm
jja at 03:49 AM on 30 January, 2015http://www.nature.com/ngeo/journal/v7/n4/full/ngeo2091.html
Michael
Anthropogenic aerosols and their indirect cloud effects are primary drivers of the PDO, this is only the first of preliminary results:
In both time periods, anthropogenic aerosols act to modify the Pacific Decadal Oscillation and therefore contribute to the width of the tropical belt.
In addition, Booth et. al (2012) correlated influence of aerosols on AMO http://www.nature.com/nature/journal/v484/n7393/full/nature10946.html
Though Zhang et. al has placed this observation in doubt. http://www.gfdl.noaa.gov/blog/isaac-held/2013/02/15/35-atlantic-multi-decadal-variability-and-aerosols/
However, the unanswered questions regarding fluctuations in the AMOC driven by aerosols that Zhang brought up raises even more interesting questions regarding interhemispheral aerosol forcing effects on the AMOC and regional forcing effects on surface wind patterns in the South West and North East Pacific.
I firmly believe that when these aerosol-ocean interactions are fully investigated we will find an entirely new anthropogenic fingerprint on surface warming. If I am correct, we will see a very large increase in surface temperatures over the coming years as China is set to reduce her aerosol emissions profile significantly with emissions controls and a likely regional economic slowdown. - Satellites show no warming in the troposphere
Rob Painting at 16:52 PM on 6 January, 2015Rob - the plot is indeed of the lower troposphere, and it was created by Carl Mears. See here. So it is genuine.
Some of the issues are that:
1. The CMIP5 collection of climate model simulations use observations up to 2005 and projected forcings thereafter.
2. Recent observations indicate that the greenhouse gas forcing in the 21st century was smaller mainly due to increased light-blocking volcanic sulfates and a weaker-than-expected solar cycle.
3. Climate models cannot accurately predict the timing of natural variation, especially the multidecadal variation associated with the warm and cool phases of the Interdecadal Pacific Oscillation (IPO). The IPO has been negative (cool surface temps) since 1999/2000 even though the ocean has been soaking up heat. The strong warming of the subsurface ocean is a testament to this.
So the issues are the same as surface temperature observation versus naive projections of the near-future forcings. When these are accounted for, the climate models are seen to be doing a very good job of simulating recent surface temperatures - within their obvious limitations.
Clearly RSS has some additional problems, as UAH and the surface temperature data sets are broadly in agreement, even though they are not measuring the same thing (radiative brightness of oxygen in the lower atmosphere vs surface temperature measured by thermometers).
- Record-Breaking Sea Surface Temperatures in 2014: Has the Climate Shifted?
wili at 21:29 PM on 30 December, 2014I need help understanding something here: In the second paragraph in the text of the article it says: "during the negative phase of the Interdecadal Pacific Oscillation (IPO) stronger winds mix more heat into the oceans"
But the graphs at figure 3 seem to show stronger winds specifically in the positive phase of the IPO. I have a feeling that 'zonal wind stress anomalies' is measuring something (to me) counterintuitive.
Any help for my bewilderment would be most welcome.
- 2014 SkS Weekly News Roundup #45B
Tom Curtis at 10:29 AM on 9 November, 2014Ashton @37:
1)
"But I don't think the AGW proponents have proved their case beyond reasonable doubt."
"Beyond reasonable doubt" is a legal standard, not a scientific standard. It is certainly not in general a policy relevant standard. "Beyond reasonable doubt" applied to tobacco smoke means we would still allow smoking in bars and restaurants. To driving, it means we would not slow if we saw a vague, child like shape in the fog ahead of us. It means the captains of ships would not attempt to evade icebergs until it was beyond reasonable doubt that they would hit it if they did not, and hence almost certain that they would hit it regardless if they did.
For policy decisions, governments act on balance of probability (when they do not act based on ideological blinkers). That is, in IPCC parlance, they act on evidence which is more likely than not. Nearly all IPCC conclusions are proved far more rigorously than that standard.
Having said that, the critics of the IPCC have had the hardest time coming up with reasonable doubts.
"A reasonable doubt is not an imaginary or frivolous doubt. It must not be based upon sympathy or prejudice. Rather, it is based on reason and common sense. It is logically derived from the evidence or absence of evidence have raised doubts by ignoring"
But the doubts raised by the pseudo-skeptics have been based on cherry picking data, ignoring the evidence and in general making every use of shyster tricks they can imagine to raise unreasonable doubts among those who find the thought of global warming to much to allow into their conception of the world.
An example of this is Ashton, who raises an unreasonable standard, and then applies it to all aspects of the theory of AGW without distinction.
2)
"This suggests natural forces do have an impact on global temperature. Who is right? Sci Am or SkS?"
And here Ashton gives an example of "unreasonable doubts". The Scientific American article did not say that natural forces have no impact on global temperatures. Only that those impacts summed to zero (or were indistinguishable from zero) for the period 1950-2010. In that they follow the IPCC exactly, who state (WG1 Chapter 10, Executive summary):
"GHGs contributed a global mean surface warming likely to be
between 0.5°C and 1.3°C over the period 1951–2010, with the
contributions from other anthropogenic forcings likely to be
between –0.6°C and 0.1°C, from natural forcings likely to be
between –0.1°C and 0.1°C, and from internal variability likely
to be between –0.1°C and 0.1°C."Note, "likely" (ie, 66% or greater probability), not "beyond reasonable doubt". The IPCC also states:
"It is extremely likely [95% or greater] that human activities caused more than half of the observed increase in GMST from 1951 to 2010."
And here is the actual Probability Density Function of that attribution based on Fig 10.5:

The reason this can be seen in an indicator of the major source of internal variability in temperature, the inverted SOI:
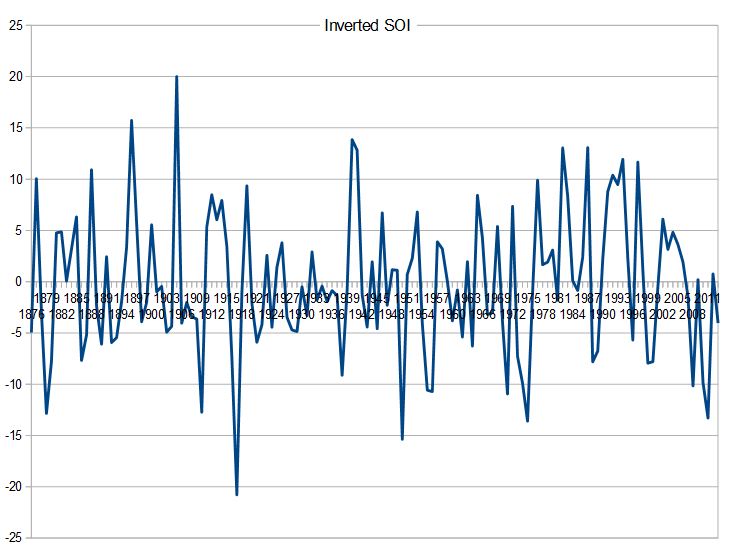
It must be born in that the IPCC is comparing differences in multi year averages of temperatures, not individual years. That is why they take the difference between 1950 and 2010 to be 0.6 C, not the actual (according to HadCRUT4) 1.01 C. And with that in mind, it is clear that the net ENSO effect on temperature differences between the two periods has been negative.
At the same time, the effects of the Atlantic Multidecadal Oscillation and Pacific Decadal Oscillation have been neutral between 1950-2010:
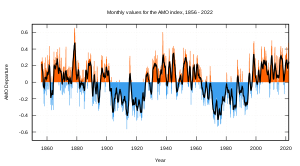

So, the Scientific American article, and the IPCC findings on which it is based do not assume that internal variability has no effect on temperature. Only that that effect between 1950 to 2010 (trend figures) are neglibly different from neutral.
- Your questions on climate sensitivity answered
MA Rodger at 19:06 PM on 28 September, 2014Lewis & Curry (2014) is pretty much what you'd expect from the title 'The implications for climate sensitivity of AR5 forcing and heat uptake estimates' and from its authors - a bean-counter meets a quasi-holistic climatologist. The thrust of the study is to take the numbers from AR5 WG1 Appendix2 and shove the implications of them back at the IPCC. This is easily done but there is quite a bit of cheese-paring required to get the desired result. For instance, note how the 'headline' 1859-2011 result when compared with Otto et al inc. Lewis (2013) loses 5% of the ∆T and gains 25% of the ∆(F-Q).
And choosing a different temperature record than HadCRUT4 would gain 5-10% more ∆T. The comparing of peak temperatures from late-1800s & mid-1900s is potentially questionable unless you are signed up to a big constant-amplitude multi-decadal oscillation. There is certainly room for significantly higher sensitivity by taking different time periods if the Appendix 2 forcings are taken at face value (which is what the study is about). And as most of the warming has occurred recently, slow feedbacks will not have had time to act for 'most of the warming'. And the one natural wobbler of temperature that is beyond doubt, ENSO, is an unknown for the post-1850 period. ENSO could have elevated the 'headline' base temperatures just as it has mainly depressed the 'headline' end period. That could easily have clipped 10% off the ∆T used bt Lewis & Curry. (I note the MacDonald & Case (2005) PDO reconstruction (wiki-graph) looks a bit positive for 1859-82 suggesting ENSO will indeed have been warming.)
So the headline low ECS provided by Lewis & Curry (2014) is at best controversial.
And do note, if it is as Lewis & Curry suggest, it only works if we are now about to experience a repeat of the cooling cycle seen twice before over the last 160 years. So hold onto your hats. The Kara Sea will melt away (or is it 'ice over'?) plunging the whole Northern Hemisphere into two decades of cooling and priming a negative AMO ready for another round of Wyatt's Stadium Wave. This I will enjoy seeing.
- El Niño in 2014: Still On the Way?
Timothy Chase at 09:33 AM on 11 July, 2014Joe T
The monthly Pacific Decadal Oscillation inde is available here. I would also strongly recommend the Australian Government's Bureau of Meteorology's ENSO Wrap-Up which gets updated roughly once every two weeks. The latter includes multiple tabs: Overview / Sea surface / Sea sub-surface / SOI / Trade winds / Cloudiness / Outlooks / Indian Ocean / Effects. Indian Ocean focuses on the Indian Ocean Dipole (IOD) also known as the Indian Ocean Dipole Mode Index (DMI) with recent data and basic explanations.
- Climate Models Show Remarkable Agreement with Recent Surface Warming
scaddenp at 06:18 AM on 3 April, 2014Klapper, then perhaps you should comment on the article "It's the PDO" and update us with research on this matter.
- Global warming not slowing - it's speeding up
Timothy Chase at 05:03 AM on 16 March, 2014BC, I have little doubt Rob Painting has more background in this area than I do, and would defer to him in this.
Personally, while I was aware of the existence of the gyres, I thought of their motion as being principally horizontal and hadn't considered their vertical effects. However, it makes sense that they would involve that as well, similar to hurricanes, the latter of which involve a vertical pumping action and are responsible for some of the poleward circulation of heat in both the atmosphere and ocean.
However, what I was refering to in terms of "quasi-stability" was simply the tendency of the system to chaotically move about a mean state where the mean state itself remains unchanged and the system has no overall trend. In this sense, I was refering to the system's tendency to regress towards the mean. When a trend is involved you would have regression towards the trend.
But typically the term gets used in climatology to refer to the tendency of the system to remain within any one of several states that are "stable" for only a finite time, typically according to a characteristic time scale. With ENSO the quasi-stable states would be the El Nino, La Nina and neutral states. Other oscillations may have only positive and negative quasi-stable states.
There is however one point that I would like to touch on, a potential misunderstanding, basically where I speak of constructive and destructive interference between ENSO, PDO and IPO. When one looks at how they overlap, one possibility that suggests itself is that they are essentially independent of one another, independent modes that are superimposed and simply additive in their effects.
However, one indication that this is not the case is that a correlation with lag-time exists between El Ninos and the the positive phase of PDO. The positive phase of PDO will often follow an El Nino within a matter of three to six months, thus the El Nino appears to act as a trigger for the PDO flipping states. The reason, it would seem, is that their existence and consequent interaction involves various feedbacks.
Anyway, you might find some value in a comment I made in an earlier thread several years ago that goes into things in more detail. It includes both references and links. Frankly, I do a better job there than I would be capable of at present without more review. However, at one point it refers to a piece by Atmoz that has since been taken down. This is still in the Wayback Machine.
- Global warming not slowing - it's speeding up
Timothy Chase at 04:45 AM on 15 March, 2014BC, you write:
"And when the IPO inevitably shifts back into a warm phase, all the heat now being stored in the deep oceans will be released back into the atmosphere"
I would have thought that the heat going into the deep oceans will mix in and cause a miniscule increase in temperature to that massive body of water. When the IPO shifts back won't it be a case that the surface temperature rises will more stay at the surface with the consequent effects - higher global temperatures, the world wide effects of El Nino etc.
If I might add my two cents (not sure what the exchange rate is, though)....
I believe we may be thinking largely along the same lines, but I am not so sure about your first sentence:
I would have thought that the heat going into the deep oceans will mix in and cause a miniscule increase in temperature to that massive body of water.
If you look at the sea surface temperature distributions of ENSO (the El Nino Southern Oscillation), the Pacific Decadal Oscillation (PDO) and the Interdecadal Pacific Oscillation (IPO) they are quite similar, each with North and South components, but with the ENSO being more pronounced near the equator, the PDO more pronounced in the North Pacific, and with the IPO being roughly equally pronounced in both areas.
Each of these have their atmospheric and oceanic components, where there will be changes in air pressure, winds, air temperature, water temperature and water salinity. However, I will focus principally on water temperature, and to a lesser extent, salinity.
With regard to water temperature, I don't have a comparison map for all three, but here are the PDO and ENSO:

In essence, they appear as standing waves, and they may constructively or deconstructively interfer with one another. And as such, when the IPO is in its positive phase El Ninos are more common and more pronounced, La Ninas less common and less pronounced, but this is reversed when the IPO is in its negative phase. So we can focus primarily on ENSO at this point.
ENSO is an oscillation associated with the thermohaline circulation, where what determines the density of water will be a product of both its temperature and salinity, and denser water sinks below that which is less dense. As such, warmer water may sink below cooler if the salinity of the warmer water is sufficiently greater than that of the cooler water.
Furthermore, while over the long-run, when the climate system is quasi-stable, heat going into the ocean must balance heat coming out of the ocean, over shorter timescales the net flow of heat will be into the ocean with a reduction in moist air convection due to cooler water being at the surface, warming the ocean, and at other times the net flow of heat will be into the atmosphere through greater moist air convection due to warmer water being at the surface, cooling the ocean.
Now you don't actually see that great a rise in global surface temperature during an El Nino. The rise in global surface actually occurs when the El Nino begins to dissipate. The reason is that "pool" of warmer water rises to the surface, spreads out as it begins to mix with the ocean surface, exposing a larger surface area over which moist air convection can take place, carrying more heat into the atmosphere.
Thus when the IPO is in its positive phase, this promotes stronger and more frequent El Ninos through constructive interference with ENSO and results in weaker and less frequent La Ninas through deconstructive interference. Consequently, during the positive phase, the net flow of heat will tend to be from the ocean to the atmosphere due to increased moist air convection, but during the negative phase the net flow of heat will tend to be from the atmosphere to the ocean due to reduced moist air convection.
Anyway, my apologies if this is more detail than you need, but it helps me to spell things out so that I have a better handle on what I am discussing.
- 2014 SkS Weekly News Roundup #10B
Rob Painting at 04:35 AM on 11 March, 2014Michael Whittemore - I need to get my butt into gear and finish the series of posts on deep ocean warming, but long story short; the stronger trade winds spin-up the subtropical ocean gyres - where surface water converges. Stronger surface convergence means stronger downward transport of heat down into the ocean interior because there is nowhere else for the water to go but down (taking heat from the surface with it).
When the trade winds undergo their typical multi-decadal weakening (the positive phase of the Interdecadal Pacific Oscillation) expect weaker deep ocean warming.
- It cooled mid-century
Chuck123 at 01:52 AM on 26 February, 2014I have heard it said that the Pacific decadal oscillation superimposes a sine wave of variation onto the underlying warming trend line, http://en.wikipedia.org/wiki/File:PDO.svg and that this correlates to the multidecadal variation of the rate of rise. Is there research that supports this?
- 2013 was the second-hottest year on record without an El Niño
Synapsid at 09:58 AM on 7 February, 2014Two points:
It's called the Pacific Decadal Oscillation for a reason. To refer to it as a cycle is to call it something it Isn't. I've seen deniers criticized on this very point; we shouldn't be doing it either.
I can't help thinking that it would be useful to empasize the pattern we see in the temperature curve that deniers keep pointing at as indicating a cessation of warming--there was a big jump in temperatue associated with the 1998 El Nino (the strongest on record) and since then temperatures HAVEN'T GONE BACK DOWN. Shift the discussion away from Is there a heating trend or not; the record is too short to spot a trend anyway. Emphasize that temperatures have stayed up there.
- The Oceans Warmed up Sharply in 2013: We're Going to Need a Bigger Graph
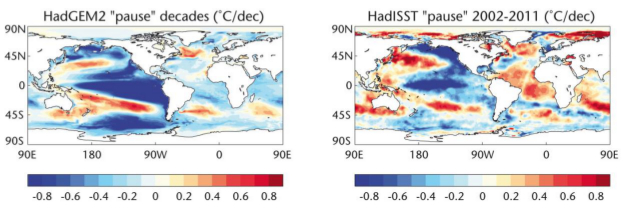
Rob Painting at 05:59 AM on 2 February, 2014BBD - I am working on a series of posts explaining the wind-driven ocean circulation, whose mean state is characterised by the sea surface temperatures evident in the Interdecadal Pacific Oscillation Index, but I'm kind of stuck on illustrating the Coriolis Effect. Hope to have that finished within a couple of weeks.
I can direct you toward scores of research papers on the subject, but I'm not sure how much sense they would make without understanding of the Coriolis force, particularly the east-west component, and Ekman pumping. The textbook; Atmosphere, Ocean and Climate Dynamics an Introductory Text by John Marshall & Alan Plumb is useful, as is the MIT GFD lab - where the 'weird properties' of rotating fluids is demonstrated in simple lab experiments.
The Zhang & McPhadden papers do indeed highlight the spin-down and then spin-up of the wind-driven ocean circulation, but one place to start is: Interaction between the Subtropical and Equatorial Ocean Circulations: The Subtropical Cell - (McCreary & Lu 1994). Typing either 'subtropical cell' or 'Pacific decadal variability' into Google Scholar will yield lots of papers on the subject.
- The Oceans Warmed up Sharply in 2013: We're Going to Need a Bigger Graph
Rob Painting at 10:51 AM on 1 February, 2014John Wise - it seems to a be natural phenomenon tied to the poleward transport of heat. Stronger easterly trade and midlatitude westerly winds spin up the subtropical ocean gyres.
As the tropical surface water is pushed westward in opposition to the Earth's eastward rotation it decelerates, and thus has slower rotational velocity than the Earth below, and relative to other 'parcels' of seawater which are rotating at the same speed as the Earth. The Coriolis force points the decelerating parcel of seawater poleward. At the midlatitudes, the westerly winds push surface seawater eastward in the same direction as Earth's rotation. Relative to the Earth and other parcels of seawater, the wind-affected parcel is now accelerating, and is therefore directed equatorward by the Coriolic force. These two near-surface currents converge in the centre of the subtropical ocean gyres and, with nowhere else to go, the water is directed downward into the ocean interior (known as Ekman pumping).
This is where the majority of deep ocean warming is occurring in the last decade or so - in the subtropical gyres. A near-coherent spin-up of all five subtropical ocean gyres was observed from the early/mid 1990's through to about 2004, when a peak was reached. They have remained in a relatively intense state since then, with a little bit of a lull between 2006-2008.
The North Pacific subtropical gyre spun up intensely in the middle of the 2013 year, and the South Pacific subtropical gyre intensified leading up to the end of 2013. Both appear to have spun down substantially since then. The South Atlantic subtropical gyre seems still to be in a spun-up state. Based on our physical understanding of this wind-driven ocean circulation, these intense spin-ups should have transported more heat to the deep ocean.
When this wind-driven ocean circulation moves into its sluggish phase (the positive phase of the Interdecadal Pacific Oscillation [IPO]), surface warming is likely rise abruptly. There are some tentative signs that this process may already be underway, but I'll have to do a bit more digging to confirm this.
- Warming oceans consistent with rising sea level & global energy imbalance
Rob Painting at 05:01 AM on 31 January, 2014Barry @ 8 - " Consistent with prevailing theories on the 'pause' slower rate of surface warming?"
Yup. See old SkS posts:
1. The Deep Ocean Warms When Global Surface Temperatures Stall
2. Ocean Heat Poised To Come Back And Haunt Us?
3. A Looming Climate Shift: Will Ocean Heat Come Back to Haunt us?
The stronger mixing of heat into the deep ocean during the negative (cool) phase of the Interdecadal Pacific Oscillation (IPO) would seem to be the primary suspect for the slower rate of surface warming, but light-blocking aerosols (around 20% according to one estimate) and a cooler than normal sun are also factors.
- Why is Antarctic sea ice growing?
Rob Painting at 19:32 PM on 13 December, 2013I would add too, that the current behaviour of the Antarctic sea ice is influenced by the present state of the ocean-atmosphere circulation. The current negative (cool) phase of the Interdecadal Pacific Oscillation (IPO) is likely assisting the growth of sea ice, but may reverse when the IPO moves to its positive (warm) phase. This can be seen in the modelled trends from Meehl (2013):
.......and the models vs observations from the UK Met Office:
- Climate Change: Years of Living Dangerously
Rob Painting at 07:30 AM on 7 December, 2013"Regarding the alleged pause, I disagree a little. This is rather a big meme. I listen to ordinary people in the street discussing clmate change, especially the sceptical ones, and this is the big thing they quote"
Yes, for now. My point was that this meme will fade. It will disappear entirely when the wind-driven ocean circulation switches phase and global surface warming rises abruptly. Of course the climate science cranks will simply move on to another meme. But I'm interested in the bigger picture, not the crank shifting of goalposts.
As for future changes in El Nino/La Nina, that's an area of great uncertainty. There are a number of research papers that claim various things. No clear picture has yet emerged. What I have observed is El Nino tends to be stronger when the circulation is sluggish (positive Interdecadal Pacific Oscillation [IPO]), and La Nina stronger when the circulation is vigorous (negative IPO).
- It's El Niño
Rob Painting at 19:17 PM on 31 August, 2013Actually SkS has been writing about this oscillation for years, a.k.a the Interdecadal Pacific Oscillation (IPO). For the latest discussion see this recent(ish) SkS post: A Looming Climate Shift: Will Ocean Heat Come Back to Haunt us?.
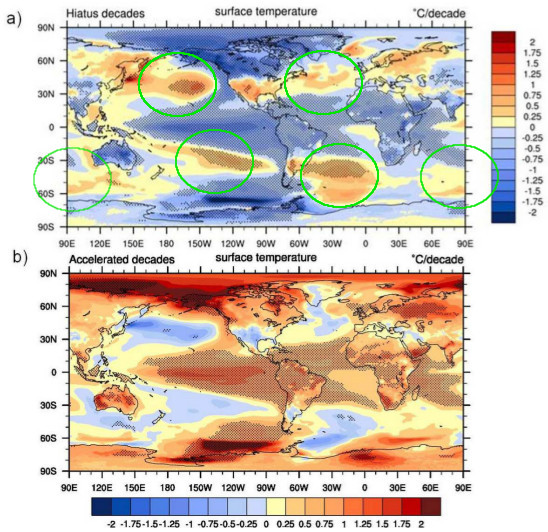
The oceans are warming due to the increased (enhanced) Greenhouse Effect (this is the upward slope in the 2nd graphic below), but the wind-driven ocean circulation moves back-and-forth between intense and sluggish phases, which results in the 'hiatus' and 'accelerated warming' decades. The net effect is illustrated in the graphics below:


SkS will have upcoming posts/rebuttals explaining this in some more detail. You'll see how the observations by Kosaka & Xie (2013) tie in nicely with the wind-driven ocean circulation.
Good to see Bob is slowly coming around to our way of thinking though. He still has a looooong way to go.
- Nils-Axel Mörner is Wrong About Sea Level Rise
Rob Painting at 06:00 AM on 2 August, 2013Michael - the Marshall Islands appear to be very close to the equator. Tropical cyclones don't form close to the equator because the Coriolis Force moves toward zero - there is no way to impart the spin necessary for cyclone formation.
Counterintuitively, the region is likely to see a decline in the rate of sea level rise once the Interdecadal Pacific Oscillation (IPO) switches from the current negative phase to a positive one. In other words, the greater-than-globally-averaged sea level rise is a result of the extra water mass being pushed there as a result of winds which power the wind-driven circulation. When those winds weaken, so too will the rate of sea level rise in that region.
- Why doesn’t the temperature rise at the same rate that CO2 increases?
Timothy Chase at 18:23 PM on 24 July, 2013Correction: last sentence should be "... I believe this is primarily due to the fact that la Ninas tend to dominate rather than el Ninos." During the negative phase of the PDO, la Ninas are more common, el Ninos less so, and during la Ninas the ocean tends to store heat that is released during an el Nino.
Regarding the relationship between el Ninos and the PDO, please see Comparing ENSO and PDO and The Pacific Decadal Oscillation (Climate Impacts Group, University of Washington)
However, there has also been talk of the character of ENSO changing as the result of global warming, where depending up the climate model, more "el Nino"-like or more "la Nina"-like conditions tend to dominate.
- Why doesn’t the temperature rise at the same rate that CO2 increases?
Timothy Chase at 17:55 PM on 24 July, 2013David, you might want to check out:
A Looming Climate Shift: Will Ocean Heat Come Back to Haunt us? by Rob Painting, 24 Jun 2013
Basically, the Pacific Decadal Oscillation (or more recently "Interdecadal Pacific Oscillation) is in its negative phase, and during this time the ocean tends to store heat. I may be wrong, but I believe this is primarily due to the fact that it la Ninas tend to dominate rather than el Ninos.
- They didn't change the name from 'global warming' to 'climate change'
Rob Painting at 05:40 AM on 18 July, 2013Nichol - the heat being transported downward and poleward by the currently intensified wind-driven ocean circulation may be shielding us from more warming of global surface temperatures but, based on past observations and modelling, it is unlikely to persist. The global weather tends to oscillate between periods where heat is stored in the deeper ocean layers (negative Interdecadal Pacific Oscillation), and periods where it remains in the surface layers (postive IPO). A long-term warming background climate does not cause La Nina or El Nino (which are largely responsible for this natural variation) to disappear.
The following images should make this clearer - the variation is unrealistically smooth, but it's just for illustrative purposes.


- It's El Niño
DSL at 23:33 PM on 2 July, 2013Li et al. 2013 might be a good basis for an intermediate article here:
"Predicting how the El Niño/Southern Oscillation (ENSO) will change with global warming is of enormous importance to society. ENSO exhibits considerable natural variability at interdecadal–centennial timescales5. Instrumental records are too short to determine whether ENSO has changed6 and existing reconstructions are often developed without adequate tropical records. Here we present a seven-century-long ENSO reconstruction based on 2,222 tree-ring chronologies from both the tropics and mid-latitudes in both hemispheres. The inclusion of tropical records enables us to achieve unprecedented accuracy, as attested by high correlations with equatorial Pacific coral and coherent modulation of global teleconnections that are consistent with an independent Northern Hemisphere temperature reconstruction. Our data indicate that ENSO activity in the late twentieth century was anomalously high over the past seven centuries, suggestive of a response to continuing global warming. Climate models disagree on the ENSO response to global warming, suggesting that many models underestimate the sensitivity to radiative perturbations. Illustrating the radiative effect, our reconstruction reveals a robust ENSO response to large tropical eruptions, with anomalous cooling in the east-central tropical Pacific in the year of eruption, followed by anomalous warming one year after. Our observations provide crucial constraints for improving climate models and their future projections." - A Looming Climate Shift: Will Ocean Heat Come Back to Haunt us?
CBDunkerson at 22:22 PM on 24 June, 2013It is interesting that the 20th century IPO phases seem to line up fairly well with another cycle I've heard about more frequently in the past, the 'Pacific Decadal Oscillation' (PDO). From what I can gather on the geography of where they each occur these aren't the same thing, but it seems likely that there is some connection.
Both cycles also line up with previous 'warming breaks' in the early 1900s and 1950s to 60s. The previous warming break is often attributed to aerosol pollution blocking incoming sunlight and that is also considered a possible cause of the current 'slow down' in atmospheric warming, but seems unlikely to have been a significant factor when atmospheric temperatures dipped ~1910. Meehl's model showing a mechanism for this correlation between the IPO cycle and warming shifts suggests that the 'natural cycle' is a principal factor, though it would still be useful to nail down how much aerosol pollution is contributing to the effect.
Given that IPO cycles seem to last between 15 and 30 years I'm not sure we can say the shift back is going to happen 'soon'. It could be any time now... or 15 years down the road.
- A Looming Climate Shift: Will Ocean Heat Come Back to Haunt us?
Rob Painting at 18:56 PM on 24 June, 2013Individuals will make their own decision as to whether they find this information alarming or not. The consequences of a shutdown of the wind-driven ocean circulation could be very profound. As for previous behavior of the Interdecadal Pacific Oscillation, given that many readers will not be familiar with this index - I'm writing a follow-up to this post.
- The anthropogenic global warming rate: Is it steady for the last 100 years? Part 2.
KK Tung at 07:18 AM on 24 May, 2013In reply to post 104 on the relevance of the recent hiatus to the present thread on the Tung and Zhou (2013) paper: That paper offered one possible explanation for the observed hiatus observed since 2005, as due to a recurrent internal variability. Therefore it is relevant (thank you, Dikran, for pointing this out in post 105). There are many other suggestions, including coal burning in the emergent economy of China (Kaufmann et al. [2011] ), increases in stratospheric water (Solomon et al. [2010] ), or increases in “background” stratospheric aerosol (Solomon et al. [2011] ). I in no time suggested that ours is the only explanation. The most recent explanation is that the heating from the greenhouse gas induced radiative imbalance goes into the deep ocean. There are two timely paper by Jerry Meehl and his co-workers: One is published in 2011 in Nature Climate Change,vol 1, page 360-364, entitled : "Model based evidence of deep ocean heat uptake during surface temperature hiatus periods". The other is currently under consideration at J. Climate, entitled "Externally forced and internally generated decadal climate variability associated with the Interdecadal Pacific Oscillation". They are very relevant to our current thread.
Meehl et al used CCSM4 model run with a future scenario (RCP4.5), which does not have oscillatory variations in the forcing or dips such as those by volcano eruptions. With smooth forcing, the 5-member ensemble mean model global mean temperature is also smoothly increasing. However the individual members show variability about the mean of around 0.5 K from peak to trough. These papers are not about how good the model is in comparison with observation.
From an energy balance standpoint, the top of the atmosphere radiative imbalance driven by the anthropogenic forcing should be accounted for mostly by the heat uptake in the oceans, as land and ice have much lower heat capacity. In the model this heat budget can be done exactly. Meehl et al defined the hiatus period as when the surface temperature has a negative trend even in the presence of increasing radiative driving. They found that during the hiatus period, the composite mean shows that the upper ocean takes significantly less heat whereas the ocean below 300m takes up significantly more, as compared with the non-hiatus period. The second paper compares hiatus periods with accelerated warming periods, and finds the opposite behavior: the upper ocean takes up more heat and the deeper ocean much less.
The question is, what causes some periods to have more heat going into the deep ocean while some other periods the heat staying more in the upper ocean? I suggest that this is caused by the internal variability that we were discussing earlier. Our previous exchanges hopefully established the viewpoint that we should view the ensemble mean as the forced solution and the deviations from the ensemble mean by each member as internal variability. There are no hiatus periods in the forced solution under the CCSM4 RCP4.5 experimental setup. In fact this solution is smoothly increasing in its global mean temperature. It is the internal variability, possibly associated with variations in the deep overtuning circulations in the oceans, which determines when a portion of the heat should go to the deep ocean and show up as warming hiatus, and when it should stay near the surface, and show up as accelerated warming. ENSO, which we generally view as internal variability, also has this kind of vertical distribution variability in the oceans: In La Nina, the upper ocean is cool while the heat goes to the deeper ocean, and opposite behavior in El Nino.
The CCSM4 is known to have internal variability that is faster than in the observation. Instead of having hiatus periods of about 2-3 decades in the observation its cooling periods last 1-2 decades. This may possibly be caused by too rapid a vertical mixing in the ocean but I do not know for sure. The Interdecadal Pacific Oscillation (IPO) that was discussed by Meehl et al is the low frequency portion of the Pacific Decadal Oscillation (PDO). In the observation the IPO cooling periods coincides with the cooling periods of the AMO, which led me to suspect that the IPO is just the Pacific manifestation of the AMO, which is caused by the variations of the Atlantic Meridional Overturning Circulation.
- The anthropogenic global warming rate: Is it steady for the last 100 years? Part 2.
MS1 at 10:30 AM on 23 May, 2013#46 scaddenp at 08:54 AM on 17 May, 2013
"MS1 "I think their paper failed " really?... If the ENSO index was substantially flawed or there was significant non-linearity, this isnt born out by the success of their prediction. If you believe that the prediction can be improved significantly by other indexes or method, then show us."
---------------------
Compo et al 2010 have addressed this issue.
http://www.esrl.noaa.gov/psd/people/gilbert.p.compo/CompoSardeshmukh2008b.pdf
"Because its [ENSO's] spectrum has a long low frequency tail, fluctuations in the timing, number and amplitude of individual El Nino and La Nina events, within, say, 50-yr intervals can give rise to substantial 50-yr trends..."
"...it also accountd for an appreciable fraction of the total warming trend..." (see figure 9b )
"...It [The Pacific decadal oscillation or the interdecadal Pacific oscillation] is strongly reminiscent of the low-frequency tail of ENSO and has, indeed been argued to be such in previous studies (e.g. Alexander et al 2002, Newman et al 2003, Schneider and Cornuelle 2005, Alexander et al 2008)..."
"...In this paper, we have argued that identifying and removing ENSO-related variations by performing regressions on any single ENSO index can be problematic. We stressed that ENSO is best viewed not as a number but as an evolving dynamical process for this purpose..."
- The anthropogenic global warming rate: Is it steady for the last 100 years? Part 2.
Dumb Scientist at 05:49 AM on 22 May, 2013In my first post, I discussed the uncertainty regarding the net anthropogenic forcing due to anthropogenic aerosols, and why there is no obvious reason to expect the anthropogenic warming response to follow the rapidly increasing greenhouse gas concentration or heating, as DS seemed to suggest. [KK Tung]
I suggested that anthropogenic forcings were faster after 1950. In response, you discussed logarithms and aerosols that were already taken into account in the IPCC radiative forcings chart I originally linked:

Then you linked to that same forcings chart and linked to another:
 - radiative forcings")
The estimates you linked both show that anthropogenic forcings increased faster after 1950. So do the GISS and Potsdam estimates. Perhaps all these estimates are wrong, but you can't prove them wrong by assuming linearity for anthropogenic forcing.
We did not assume linearity for anthropogenic forcing. In the post we used a number of nonlinear anthropogenic indices. [KK Tung]
Again: You regressed global surface temperatures against the AMO in order to determine anthropogenic warming. Because the AMO is simply linearly detrended N. Atlantic SST, this procedure would only be correct if AGW is linear. Otherwise you'd be subtracting AGW signal, sweeping some AGW into a box you've labelled "natural" called the AMO.
Physical justification of AMO being mostly natural or anthropogenically forced needs to precede the choice of the index. This was what we did in our PNAS paper. [KK Tung]
I already addressed this point: Removing the AMO to determine anthropogenic warming would only be justified if detrending the AMO from 1856-2011 actually removed the trend due to anthropogenic warming.
There is a concern that the AMO index used in our multiple regression analysis is a temperature response rather than a forcing index. Ideally, all predictors in the analysis should be external forcings, but compromises are routinely made to account for internal variability. [KK Tung]
Predictors are compromised to the extent that warming the globe also changes those predictors. Not all such compromises are created equal.
The solar forcing index is the solar irradiance measured outside the terrestrial climate system, and so is a suitable predictor. Carbon dioxide forcing is external to the climate system as humans extract fossil fuel and burn it to release the carbon. Volcanic aerosols are released from deep inside the earth into the atmosphere. In the last two examples, the forcing should actually be internal to the terrestrial system, but is considered external to the atmosphere-ocean climate system in a compromise. [KK Tung]
These barely qualify as compromises. Global warming doesn't force humans to burn fossil fuels. Also, there's no published mechanism (that I know of) linking global warming to volcanic activity.
Further compromise is made in the ENSO "forcing". ENSO is an internal oscillation of the equatorial Pacific-atmosphere system, but is usually treated as a "forcing" to the global climate system in a compromise. [KK Tung]
This is more of a compromise, as I noted: "Even though global warming might indirectly affect ENSO, it's important to note that it hasn't yet: the ENSO index doesn't have a significant 50-year trend. This means it can be subtracted without ignoring AGW."
Because ENSO doesn't have a significant multidecadal trend, this ENSO compromise can't (and doesn't) ignore AGW over multidecadal (i.e. climate) timescales.
It is in principle better to use an index that is not temperature, and so the Southern Oscillation Index (SOI), which is the pressure difference between Tahiti and Darwin, is sometimes used as a predictor for the ENSO temperature response. [KK Tung]
I agree: it's better to use an index that isn't temperature.
However, strictly speaking, the SOI is not a predictor of ENSO, but a part of the coupled atmosphere-ocean response that is the ENSO phenomenon. In practice it does not matter much which ENSO index is used because their time series behave similarly. [KK Tung]
It wouldn't matter much even if you forgot to regress against ENSO altogether, because ENSO doesn't have a significant multidecadal trend. Regressing against ENSO primarily reduces the uncertainties on the recent multidecadal trend; it doesn't significantly change that trend.
It is in the same spirit that the AMO index, which is a mean of the detrended North Atlantic temperature, is used to predict the global temperature change. It is one step removed from the global mean temperature being analyzed. [KK Tung]
The AMO index is a seriously compromised predictor because warming the globe also warms the N. Atlantic, and anthropogenic forcing is faster after 1950. I've obviously failed to communicate this point, which is why I asked you two questions:
Question 1
Would regressing global surface temperatures against N. Atlantic SST without detrending the SST remove some anthropogenic warming from global surface temperatures?
Yes or no?
Question 2
Now suppose we regress global surface temperatures against N. Atlantic SST after linearly detrending the SST. In other words, we regress against the standard AMO index as Tung and Zhou 2013 did.
Just imagine that anthropogenic forcings increased faster after 1950. In that case, would regressing global surface temperatures against the AMO remove some anthropogenic warming from global surface temperatures after 1950?
Yes or no?
I'll start: my answers are yes and yes. In fact, I think answering yes to question 1 also implies a yes to question 2, but I'm willing to be educated.
Since you never answered these questions, I have to guess at your answers:
By "the upward trend of the AMO" I assume you are referring to the North Atlantic mean SST, because AMO is supposed to be detrended. I agree that anthropogenic forcing can force an upward trend in the N. Atlantic mean SST. In fact I am quite certain of it. [KK Tung]
Linearly detrended, which means that nonlinear anthropogenic forcing can force a recent upward trend in the AMO. Regardless, your certainty seems to imply that you'd answer "yes" to my question 1. That's fortunate, given that N. Atlantic SST are highly correlated with global surface temperatures:

You've repeatedly pointed out that you used a nonlinear anthropogenic index, and that the result is "very close" to the result using a linear index. Perhaps that's why you think that it's possible to answer yes to question 1 but no to question 2?
If so, I disagree. Because N. Atlantic SST and global surface temperatures are so highly correlated, I think bouke was right to point out that any other predictor will just be a distractor. I suspect that's why you get answers that are "very close" regardless of the assumed anthropogenic index. Unfortunately, I haven't found your code online, and don't have the time to independently reproduce your methodology.
There is a very nice blog by Isaac Held of Princeton, one of the most respected climate scientists, on the AMO debate here. [KK Tung]
I also respect Isaac Held, which is why I linked that post as well as this one:
"... While the specifics of the calculations of heat uptake over the past half century continue to be refined, the sign of the heat uptake, averaged over this period, seems secure - I am not aware of any published estimates that show the oceanic heat content decreasing, on average, over these 50 years. Accepting that the the sign of the heat uptake is positive, one could eliminate the possibility of [the fraction of the temperature change that is forced] < ~3/4 ..." [Isaac Held]
Note that Isaac Held's analysis is based on thermodynamics, not curve-fitting the AMO. As such, when he claims that the fraction of the temperature change over the last 50 years due to internal variability is less than ~25%, he's summing over all modes of internal variability, not just the AMO. As I've discussed, this is essentially the same conclusion reached by Huber and Knutti 2012.
As KR noted, Anderson et al. 2012 says that less than 10% of the warming over the last 50 years could be due to internal variability.
Your claim of ~40% is inconsistent with studies that base their claims on thermodynamics rather than curve-fitting.
You probably are aware of the discussions on the recent hiatus in warming for the past 17 years. [KK Tung]
I'm aware that there hasn't been a statistically significant change in the surface warming rate.
- The anthropogenic global warming rate: Is it steady for the last 100 years? Part 2.
K.a.r.S.t.e.N at 00:04 AM on 18 May, 2013KK Tung @10:
I am referring to forcing from tropospheric (anthropogenic) and stratospheric (volcanic) aerosols likewise. They have an impact on both, the AMOC and the AMO. Sure, the response of the AMOC to external forcing is slower and hence harder to identify, but neither AMOC nor AMO are independent of it. I agree that the AMO is influenced by the AMOC (how can it not). The exact linkage is still under debate. However, I strongly disagree with your reply to Kevin C in post 8 and your notion that a volcanic impact on the AMO is unlikely. Let me try to convince you.
In your paper, you wrote: “The 20-y small dip in temperature near 1810 coincides with the solar Dalton Minimum, but is probably caused by a negative excursion of the AMO. The rising AMO cycle in the first half of the 19th century produced a warming, despite the eruption of Tambora (1815), the largest in the past four centuries.”
The problem is that we have a strong volcanic eruption in 1809 (unknown tropical eruption; see Cole-Dai et al. 2009 or Arfeuille et al. 2013), followed by the 1815 Tambora eruption (strongest eruption in the last centuries). Hence I have no doubt whatsoever as to what the reason of the negative AMO excursion is. It’s entirely attributable to these two strong eruptions. The surface air temperature over the Atlantic-Arctic boundary in your Fig.3C perfectly matches the timing of these eruptions. If we go on to the 1830s, we see the next dip which perfectly matches with the Babuyan Claro eruption (1831) and the next very strong eruption at Cosiguina in 1835. The dip around 1860 is stronger than one would expect from the amplitude of the corresponding eruption recorded in 1861, only to have a clear signal for the Krakatau eruption in 1883 again. Note that the exact magnitude of the volcanic forcing differs between different estimates. I plotted the older dust veil index (DVI) and the newer ice core index (ICI) from Crowley and Unterman 2012 for the time period 1750-2000 in order to illustrate my point.
Moreover, I consider it very likely that volcanic eruptions do have a measurable effect also on the AMOC. Gleckler et al. 2006 and Stenchikov et al. 2009 demonstrate that a persistent deep ocean signal emerges after strong volcanic eruptions. Therefore, most of the time the climate system is not in an equilibrium state as it takes several centuries to get rid of any remaining signal from volcanic eruptions. As soon as there is a lull in volcanic activity, the climate system warms in order to restore equilibrium. I don’t know how strong this warming signal is, but it definitely plays a role in post-volcanic periods such as that between 1910-1940. I agree with Tom Curtis (post 40), that this period saw some additional warming in the North Atlantic region due to increasing black carbon forcing (while anthropogenic sulfate forcing was barely rising during that very time). The external forcing impact on the AMOC is also widely discussed in the literature, with numerous suggestions as to what mechanisms could be at play. I would like to point at a very recent paper by Menary et al. 2013 or another one by Iwi et al. 2012. It goes without saying that undoubtedly internal AMOC variability exists undoubtedly. The review paper by Kuhlbrodt et al. 2007 gave a good overview.
Similar to what Kevin C did (see post 21), I recently developed my own two-box EBM model which accounts for volcanic eruptions at two time-scales: A fast surface temperature response which more or less coincides with the stratospheric AOD evolution, and a slow response which accounts for the deep-ocean signal as shown for the Tambora and the Pinatubo eruptions in Stenchikov et al. 2009. In addition, instead of using the GISS forcing (which I personally consider not very accurate regarding the tropospheric aerosol forcing) I used the forcing time series for sulfate and black carbon aerosols presented in Skeie et al. 2011. The resulting forcing function (nudged towards NH conditions) for the 1750-2010 period looks like this (I can provide more details upon request):

Not only are the volcanic spikes easy to identify, but also becomes their long-term effect noticeable. I am not claiming that this is the real volcanic fingerprint which we find in the observations, but it indicates where we might have to look for a forced disturbance in the thermohaline circulation, may it be the AMOC or ENSO/PDO. Let’s compare the forcing function with the NH instrumental observations and reconstructions:

Note that the temperature response in Europe as represented by the Berkeley Best data and Baur temperature series (both are comparable with the AMO temperature trends) is not always in phase with the rest of the NH. In fact, there is reason to think that the NAO response to volcanic eruptions is preferably positive. Fischer et al. 2007 have a good discussion on that. Assuming that the NAO and the AMO mutually influence each other, stochastic multi-annual or decadal variations as a result are all but surprising. Even in the absence of NAO-like atmospheric variability, Deser et al. 2010 brilliantly illustrate how white noise from pure random atmospheric heat flux variations turns into (oceanic) red noise. The time scale of the resulting SST fluctuations depends on the ocean mixed-layer height. It is interesting to note that the mixed-layer depth of the North Atlantic is comparably high, particularly in winter, which can easily explain the high standard deviation of its SSTs. The same is true for large portions of the North Pacific.
This brings me to DelSole et al. 2011, which you cited in your response. Likewise, they identified these very regions as most variable. However, I can’t see how the “projection” of the observed temperatures onto this pattern removes the problem of unreliable model forcing. As can be seen from my best-guess forcing assumption for the NH (which includes aerosol indirect effects, which most models omit altogether), the real forcing has likely been considerably more variable than assumed in your analysis as well as in their analysis (which is based in the forcings of the models used). This can also be illustrated by looking at the NH/SH inter-hemispheric temperature trend. Not only does it differ considerably, but also is the NH instrumental record strongly correlated with the anthropogenic sulfur emissions, which is almost certainly not a mystic coincidence.
Many other issues regarding the robustness of your results have been raised in the discussion already. I agree with Tom Curtis (post 11/15) on the magnitude of the AMO signal in the NH temperature variance, which I believe your method terribly deflates, as well as on the consistency and significance of the oscillation in the data (post 15/20), which I believe you have not demonstrated. Conservation of energy is another is another big problem (see e.g. KR in post 14) which you have so far failed to address properly.Finally, let me show you what happens if we extend the forcing time series back in time and keep comparing it with paleo-reconstructions. With a low-pass filter it looks like this:

From a NH point of view, the AMO plays a minor role as far as the temperature evolution is concerned. Not to mention global temperatures. The AMOC is important on longer time scales, typically in response to slow changes in external forcing. On shorter time-scales, AMOC changes can have strong regional impacts. The AMOC shutdown in the context of the 8.2ka event as the prime example for its response to strong fresh water pulses.
- Another Piece of the Global Warming Puzzle - More Efficient Ocean Heat Uptake
Rob Painting at 19:16 PM on 16 May, 2013R Gates - There are two aspects to ocean warming; increased greenhouse gas content of the atmosphere warms the cool-skin layer of the ocean and lowers the thermal gradient through that layer. Less heat (from sunlight) leaves the ocean and the surface ocean grows warmer over time. That's why the oceans are warming despite a reduction in solar radiation over the last 3 decades.
Secondly; the oceans are not passive. They have changed in response to warming, and also have a large natural variability component. Were this not so, only the surface oceans would warm, the surface layers would stratify, and surface warming would be occurring much faster than it is. The recent acceleration of ocean heat content is exaggerated due to the negative phase of the Pacific Decadal Oscillation happening on top of the long-term ocean warming trend. At some stage we are likely to see a return to the positive phase - so ocean warming will slow down.
Current observations are consistent with paleodata from warm intervals in Earth's ancient past. The equator-to-pole and, surface-to-deep ocean temperature gradients were reduced when compared to modern-day. This implies stronger transport of heat to the deep ocean and polar oceans than is going on today, and suggests the observations are tracking in that direction.
I believe a lot of the confusion stems from readers not understanding how the oceans really operate - Coriolis Effect, ocean gyres, Ekman transport, and so on. Working on fixing that.
- Another Piece of the Global Warming Puzzle - More Efficient Ocean Heat Uptake
Rob Painting at 12:40 PM on 15 May, 2013R Gates - short-term sea surface temperatures are a poor diagnostic tool for global warming because they are strongly influenced by natural variability. A key point in Figure 1 is that very little energy is being lost from the climate system - surface temperatures are cool because of a rearrangement of heat in the ocean. During the negative phase of the Pacific Decadal Oscillation, more warming goes into the deep ocean.
If a significant portion of heat were being lost from the ocean, then it must warm surface air temperatures, before reaching the upper atmosphere and being radiated out to space. There is no way around that. That does not appear to have happened. The most likely scenario is that suggested by the climate model in Meehl (2011) & Meehl (2013) - the majority of this slowing of surface temperatures is due to natural variabilty (deep ocean warming) superimposed atop a long-term warming trend (greenhouse gas-induced warming of the surface ocean).
As for your comment about the Pacific Ocean warming, not sure what you find so perplexing about that.
- Another Piece of the Global Warming Puzzle - More Efficient Ocean Heat Uptake
Rob Painting at 20:25 PM on 13 May, 2013R Gates - Increased heat transport into the deep ocean is broadly consistent with what is known about the wind-driven ocean circulation. Stronger tropical easterly trade winds during La Nina-dominant periods (negative Pacific Decadal Oscillation [PDO]) will lead to stronger Ekman pumping in the ocean gyres. Indeed, one can see the piling up of water in the Western tropical Pacific in the sea level trend over the period of satellite altimetry (1993-to present) - a clear sign of the intensified winds there. Additionally, the intensified winds of the mid-latitude westerlies, and a poleward shift of the strongest winds toward the Antarctic Circumpolar Current will also lead to stronger convergence of surface currents, and stronger downward heat transport.
This will throttle back when we enter a period of El Nino-dominance (positive Pacific Decadal Oscillation) because the easterly trade winds will weaken. Less heat will be mixed into the deep ocean and more will remain at the surface - to be exchanged with the atmosphere. So, even though global warming will slow during that time, surface warming will speed up.
John Brookes - light-blocking sulfate pollution from global industrial activity has been declining since about 2007. This is primarily from the installation of scrubbing technology in Chinese smokestacks.
It is interesting, however, that the slowdown in ocean heat content accumulation during 2004-2007/2008 coincides with a strong global dimming during that interval. There is a tendency to ascribe changes to only one variable, but in reality a combination of variables may explain recent events.
There is the worrying possibility that 3 variables may have acted to slow surface warming during that time; the negative phase of the PDO, industrial sulfate pollution, and increased sulfates from increased volcanism of tropical volcanoes. Let's hope that that wasn't the case - it would imply significant surface warming when these 3 are no longer holding back greenhouse gas warming.
- Guemas et al. Attribute Slowed Surface Warming to the Oceans
Rob Painting at 14:19 PM on 27 April, 2013Carl - the most likely scenario is that surface warming will rapidly increase when the climate returns to an El Nino-dominant period (or positive phase of the Pacific Decadal Oscillation, if you like). It's not impossible that La Nina will continue to dominate, but it's not what we expect, and is not a robust prediction of climate modelling.
It important to realize that the warming of the deep ocean will not affect global surface temperatures for hundreds of years. It's the heat that accumulates in the upper ocean that is exchanged with the atmosphere during ENSO events. So, based on the period of observations, and climate models, the natural oscillation of global weather (La Nina-neutral-El Nino) will likely continue - and we're about due for the positive phase of the PDO. The Earth might have other ideas however.
Perhaps the salient point glossed over in these discussions is that global warming (the energy absorbed in all the global heat reservoirs) typically increases much faster during La Nina-heavy periods - due to greater heat uptake by the ocean, and slows down during El Nino - as a large flux of heat leaves the oceans and warms the atmosphere on its way out to space.
- The anthropogenic global warming rate: Is it steady for the last 100 years?
KK Tung at 01:09 AM on 14 April, 2013In answer to MA Roger at post 21: Now we are getting to the point! Please read our paper, Tung and Zhou. MLR is a mathematical procedure, not a physical one. In our paper it came towards the end after evidence---and there were many pieces----was presented that supports physically the need to remove the AMO to reveal the anthropogenic response. Then we said, "Now we are in a position" to do this quantitative analysis, which is the MLR. You would be right if all we did were to see an AMO-like bent in the data and we removed that. Someone else may disagree with the evidence that we presented and have a better argument for removing the Pacific Decadal Oscillation, for example. Then he/she would then do a MLR using the PDO as a regressor. This is the scientific process. Neither is circular. I would accept his/her MLR result over mine if I find his physical argument and observational evidence presented more compelling.
On your last point. Consider the case of a time series--let's use it as the observation----that contains a nonlinear "anthropogenic " signal and a white noise. And nothing else. Suppose the noise is large and I can't see the anthropogenic signal without doing the MLR analysis, but I do not know what to use for the anthropogenic regressor. So I have to guess. Now suppose I am lucky and chose a regressor that happens to be varying in time like that nonlinear signal. After doing the MLR the residual is found and I examine that carefully. I see that it is white noise. The conclusion I would then make is that the MLR is successful and the anthropogenic signal is nonlinear. If on the other hand I am unlucky and picked a linear function as my regressor, then the residual will not be just noise, but have some trends as well. Then I would conclude that my MLR is not successful and the anthropogenic signal should be nonlinear. Then for my second try I would pick a more nonlinear regressor, until the residual becomes just noise.
- New Research Confirms Global Warming Has Accelerated
bjchip at 21:53 PM on 26 March, 2013"So what's causing this transfer of heat to the deeper ocean layers? The authors suggest that it is a result of changes in winds related to the negative phase of the Pacific Decadal Oscillation and more frequent La Niña events."
OK... I'm sort of puzzled here. The PDO is what it is and the Meehl paper seems to explain the heat transfer.... though warm water going down seems "odd" ... but how does the wind carry heat into the deep ocean? Wind can carry less heat away from the surface? Is this a loosely worded summary that misleads? Looking at what the links to the briefs on Meehl say I am missing something ?
- Tung and Zhou circularly blame ~40% of global warming on regional warming
dvaytw at 03:49 AM on 23 March, 2013I'm almost embarrassed to pipe up in these threads because my science knowledge is so sub-par, but I can't resist pointing out: at WUWT right now this AMO is undoubtedly the hot topic.
Does it ever occur to anyone there that this is the God-only-knows-how-many-eth "alternative explanation" they've embraced for warming? First it was the sun, then it was volcanoes, then it was cosmic rays, then it was the Pacific decadal oscillation, now it's the ~Atlantic~ decadal oscillation (I might have the order wrong).
Funny how the one unifying "theory" seems to be Whatever It Is, It ~Ain't~ Greenhouse Gases! That right there to me ought to be a huge red flag to them that motivated reasoning and not genuine curiosity is in the driver's seat.
- It's El Niño
John Hartz at 09:37 AM on 8 December, 2012
In my opinion, neither the OP nor Bob Tisdale provides an adequate explanation of ENSO.
For an up-to-date and authoritative description of ENSO, see:
El Niño and Southern Oscillation (ENSO): A Review by Chunzai Wang, Clara Deser, Jin-Yi Yu, Pedro DiNezio, and Amy Clement.
Chunzai Wang , NOAA Atlantic Oceanographic and Meteorological Laboratory, Miami, Florida
Clara Dresser, National Center for Atmospheric Research, Boulder, Colorado
Jin-Yi Yu, University of California at Irvine
Pedro DiNezio, International Pacific Research Center, University of Hawaii
Amy Clement, School of Marine and Atmospheric Science, University of Miami
Abstract
The ENSO observing system in the tropical Pacific plays an important role in monitoring ENSO and helping improve the understanding and prediction of ENSO. Occurrence of ENSO has been explained as either a self-sustained and naturally oscillatory mode of the coupled ocean- atmosphere system or a stable mode triggered by stochastic forcing. In either case, ENSO involves the positive ocean-atmosphere feedback hypothesized by Bjerknes. After an El Niño reaches its mature phase, negative feedbacks are required to terminate growth of the mature El Niño anomalies in the central and eastern Pacific. Four negative feedbacks have been proposed: reflected Kelvin waves at the ocean western boundary, a discharge process due to Sverdrup transport, western Pacific wind-forced Kelvin waves, and anomalous zonal advections. These negative feedbacks may work together for terminating El Niño, with their relative importance varying with time. Because of different locations of maximum SST anomalies and associated atmospheric heating, El Niño events are classified as eastern and central Pacific warming events. The identification of two distinct types of El Niño offers a new way to examine global impacts of El Niño and to consider how El Niño may respond and feedback to a changing climate. In addition to interannual variations associated with ENSO, the tropical Pacific SSTs also fluctuate on longer timescales. The patterns of Pacific Decadal Variability (PDV) are very similar to those of ENSO. When SST anomalies are positive in the tropical eastern Pacific, they are negative to the west and over the central North and South Pacific, and positive over the tropical Indian Ocean and northeastern portions of the high-latitude Pacific Ocean. Many mechanisms have been proposed for explaining PDV. Changes in ENSO under global warming are uncertain. Increasing greenhouse gases changes the mean states in the tropical Pacific which in turn induce ENSO changes. Due to the fact that the change in mean tropical condition under global warming is quite uncertain even during the past few decades, it is hard to say whether ENSO is going to intensify or weaken, but it is very likely that ENSO will not disappear in the future.
Particularly germane to the recent dialogue between Bob Tisdale and others on this comment thread are the two sentences that I have bolded in the above Abstract. - It's El Niño
Bob Tisdale at 19:48 PM on 7 December, 2012doug_bostrom says at 142: “Bob, where's the heat pump? How does it function?”
I don’t know how you’re defining heat pump, doug.
But I’ll cut and paste my earlier reply to skywatcher, as an explanation of ENSO to see if it agrees with how you’re defining heat pump. I wrote:
The process through which the sun creates the warm water for El Niño events was described in my comment 139, where I replied to composer99:
El Niño and La Niña events are part of a coupled ocean-atmosphere process. Sea surface temperatures, trade winds, cloud cover, downward shortwave radiation (aka visible sunlight), ocean heat content, and subsurface ocean processes (upwelling, subsurface currents, thermocline depth, downwelling and upwelling Kelvin waves, etc.) all interact. They’re dependent on one another. During a La Nina, trade winds are stronger than normal. The stronger trade winds reduce cloud cover, which, in turn, allows more downward shortwave radiation to enter and warm the tropical Pacific.
If you’re having trouble with my explanation because it’s so simple, refer to Pavlakis et al (2008) paper “ENSO Surface Shortwave Radiation Forcing over the Tropical Pacific.” Note the inverse relationship between downward shortwave radiation and the sea surface temperature anomalies of the NINO3.4 region in their Figure 6. During El Niño events, warm water from the surface and below the surface of the West Pacific Warm Pool slosh east, so the sea surface temperatures of the NINO3.4 region warm, causing more evaporation and more clouds, which reduce downward shortwave radiation. During La Niña events, stronger trade winds cause more upwelling of cool water from below the surface of the eastern equatorial Pacific, so sea surface temperature to drop in the NINO3.4 region, in turn causing less evaporation. The stronger trade winds also push cloud cover farther to the west than normal. As a result of the reduced cloud cover, more downward shortwave radiation is allowed to enter and warm the tropical Pacific during La Niña events.
To complement that, here’s a graph to show the interrelationship between the sea surface temperature anomalies of the NINO3.4 region and cloud cover for the regions presented by Pavlakis et al.
That discussion explains why the long-term warming of the Ocean Heat Content for the tropical Pacific was caused by the 3-year La Nina events and the unusual 1995/96 La Niña. First, here’s a graph of tropical Pacific Ocean Heat Content. It’s color coded to isolate the data between and after the 3-year La Niña events of 1954-57, 1973-76 and 1998-2001. Those La Niña events are shown in red. Note how the ocean heat content there cools between the 3-year La Niña events. Anyone who understands ENSO would easily comprehend how and why that happens. It’s tough to claim that greenhouse gases have caused the warming of the tropical Pacific when the tropical Pacific cools for multidecadal periods between the 3-year La Niñas, Composer99.
As you can see, the warming that took place during the 1995/96 La Niña was freakish. Refer to McPhaden 1999 “Genesis and Evolution of the 1997-98 El Niño”.
McPhaden writes:
For at least a year before the onset of the 1997–98 El Niño, there was a buildup of heat content in the western equatorial Pacific due to stronger than normal trade winds associated with a weak La Niña in 1995–96.
Based on the earlier description, that “build up of heat content” resulted from the interdependence of trade winds, cloud cover, downward shortwave radiation and ocean heat content. Simple. As you can see in the above graph, the upward spike caused by the 1995/96 La Niña skews the trend of the mid-cooling period, and if we eliminate the data associated with it and the 1997/98 El Niño, then the trend line for the mid-period falls into line with the others.
HHH
skywatcher, so La Niña events provide the naturally created fuel for El Niño events. More ENSO basics: An El Niño releases that heat, which is stored as warm water, from below the surface of the West Pacific Warm Pool. The warm water travels east and spreads across the surface of the eastern tropical Pacific. The El Niño releases heat through evaporation into the atmosphere, which is why tropical Pacific ocean heat content drops during an El Niño. Additionally, the convection, cloud cover and precipitation accompany that warm water east, sometimes almost halfway around the globe. These changes in location of the primary source of tropical Pacific convection and the resulting changes in atmospheric circulation, not a direct transfer of heat, are what cause surface temperatures to warm in areas remote to the eastern tropical Pacific.
Further to this, as I replied to doug_bostrom in my comment 103:
On the other hand, are you aware of teleconnections? Are you aware that there’s no heat transfer with teleconnections? Example: Why do the tropical North Atlantic sea surface temperature anomalies warm during an El Nino, doug? Do you know? There’s no direct exchange of heat yet the tropical North Atlantic warms during an El Niño. Why, doug? Could it have something to do with the slowing of the trade winds in the tropical North Atlantic in response to the El Niño? That would result in less evaporation, which is the primary way the oceans release heat. If there’s less evaporation, sea surface temperatures warm, do they not? Also, when the trade winds slow in the tropical North Atlantic in response to an El Niño, there’s less upwelling of cool waters from below the surface and less entrainment of that cool subsurface water. That would cause the seas surface temperatures to warm too.
HHH
If you don’t like my explanation, skywatcher, refer to Wang (2005) ENSO, Atlantic Climate Variability, And The Walker And Hadley Circulation for a more detailed discussion. And if you’d like a discussion of teleconnections for the rest of the world, refer to Trenberth et al (2002) Evolution of El Niño–Southern Oscillation and global atmospheric surface temperatures.
A quick note about Trenberth et al (2002). They qualify the results of their global warming attribution with:
Although it is possible to use regression to eliminate the linear portion of the global mean temperature signal associated with ENSO, the processes that contribute regionally to the global mean differ considerably, and the linear approach likely leaves an ENSO residual.
The divergences between the Rest of the World data and the scaled NINO3.4 data during the 1988/89 and 1998-01 La Niña events are those ENSO residuals.
HHH
Would you consider ENSO to be a heat pump, doug?
- It's El Niño
Bob Tisdale at 19:34 PM on 7 December, 2012skywatcher at 138 says: “1: Where's the heat coming from? The oceans, globally, are warming, the atmosphere is warming, and yet the Sun is not getting any brighter. What's your energy source?”
The sun is the primary energy source, but sea surface and ocean heat content warming can and do also take place without the exchange of heat, which is the result of teleconnections. The process through which the sun creates the warm water for El Niño events was described in my comment 139, where I replied to composer99:
El Niño and La Niña events are part of a coupled ocean-atmosphere process. Sea surface temperatures, trade winds, cloud cover, downward shortwave radiation (aka visible sunlight), ocean heat content, and subsurface ocean processes (upwelling, subsurface currents, thermocline depth, downwelling and upwelling Kelvin waves, etc.) all interact. They’re dependent on one another. During a La Nina, trade winds are stronger than normal. The stronger trade winds reduce cloud cover, which, in turn, allows more downward shortwave radiation to enter and warm the tropical Pacific.
If you’re having trouble with my explanation because it’s so simple, refer to Pavlakis et al (2008) paper “ENSO Surface Shortwave Radiation Forcing over the Tropical Pacific.” Note the inverse relationship between downward shortwave radiation and the sea surface temperature anomalies of the NINO3.4 region in their Figure 6. During El Niño events, warm water from the surface and below the surface of the West Pacific Warm Pool slosh east, so the sea surface temperatures of the NINO3.4 region warm, causing more evaporation and more clouds, which reduce downward shortwave radiation. During La Niña events, stronger trade winds cause more upwelling of cool water from below the surface of the eastern equatorial Pacific, so sea surface temperature to drop in the NINO3.4 region, in turn causing less evaporation. The stronger trade winds also push cloud cover farther to the west than normal. As a result of the reduced cloud cover, more downward shortwave radiation is allowed to enter and warm the tropical Pacific during La Niña events.
To complement that, here’s a graph to show the interrelationship between the sea surface temperature anomalies of the NINO3.4 region and cloud cover for the regions presented by Pavlakis et al.
That discussion explains why the long-term warming of the Ocean Heat Content for the tropical Pacific was caused by the 3-year La Nina events and the unusual 1995/96 La Niña. First, here’s a graph of tropical Pacific Ocean Heat Content. It’s color coded to isolate the data between and after the 3-year La Niña events of 1954-57, 1973-76 and 1998-2001. Those La Niña events are shown in red. Note how the ocean heat content there cools between the 3-year La Niña events. Anyone who understands ENSO would easily comprehend how and why that happens. It’s tough to claim that greenhouse gases have caused the warming of the tropical Pacific when the tropical Pacific cools for multidecadal periods between the 3-year La Niñas, Composer99.
As you can see, the warming that took place during the 1995/96 La Niña was freakish. Refer to McPhaden 1999 “Genesis and Evolution of the 1997-98 El Niño”.
McPhaden writes:
For at least a year before the onset of the 1997–98 El Niño, there was a buildup of heat content in the western equatorial Pacific due to stronger than normal trade winds associated with a weak La Niña in 1995–96.
Based on the earlier description, that “build up of heat content” resulted from the interdependence of trade winds, cloud cover, downward shortwave radiation and ocean heat content. Simple. As you can see in the above graph, the upward spike caused by the 1995/96 La Niña skews the trend of the mid-cooling period, and if we eliminate the data associated with it and the 1997/98 El Niño, then the trend line for the mid-period falls into line with the others.
HHH
skywatcher, so La Niña events provide the naturally created fuel for El Niño events. More ENSO basics: An El Niño releases that heat, which is stored as warm water, from below the surface of the West Pacific Warm Pool. The warm water travels east and spreads across the surface of the eastern tropical Pacific. The El Niño releases heat through evaporation into the atmosphere, which is why tropical Pacific ocean heat content drops during an El Niño. Additionally, the convection, cloud cover and precipitation accompany that warm water east, sometimes almost halfway around the globe. These changes in location of the primary source of tropical Pacific convection and the resulting changes in atmospheric circulation, not a direct transfer of heat, are what cause surface temperatures to warm in areas remote to the eastern tropical Pacific.
Further to this, as I replied to doug_bostrom in my comment 103:
On the other hand, are you aware of teleconnections? Are you aware that there’s no heat transfer with teleconnections? Example: Why do the tropical North Atlantic sea surface temperature anomalies warm during an El Nino, doug? Do you know? There’s no direct exchange of heat yet the tropical North Atlantic warms during an El Niño. Why, doug? Could it have something to do with the slowing of the trade winds in the tropical North Atlantic in response to the El Niño? That would result in less evaporation, which is the primary way the oceans release heat. If there’s less evaporation, sea surface temperatures warm, do they not? Also, when the trade winds slow in the tropical North Atlantic in response to an El Niño, there’s less upwelling of cool waters from below the surface and less entrainment of that cool subsurface water. That would cause the seas surface temperatures to warm too.
HHH
If you don’t like my explanation, skywatcher, refer to Wang (2005) ENSO, Atlantic Climate Variability, And The Walker And Hadley Circulation for a more detailed discussion. And if you’d like a discussion of teleconnections for the rest of the world, refer to Trenberth et al (2002) Evolution of El Niño–Southern Oscillation and global atmospheric surface temperatures.
A quick note about Trenberth et al (2002). They qualify the results of their global warming attribution with:
Although it is possible to use regression to eliminate the linear portion of the global mean temperature signal associated with ENSO, the processes that contribute regionally to the global mean differ considerably, and the linear approach likely leaves an ENSO residual.
The divergences between the Rest of the World data and the scaled NINO3.4 data during the 1988/89 and 1998-01 La Niña events are those ENSO residuals.
- It's El Niño
Albatross at 15:32 PM on 27 November, 2012
Just swooping down to clarify a few things for Mr. Tisdale. To be accurate one should refer to the theory of anthropogenic warming or theory of human-induced warming, it is not correct to speak of the "hypothesis of anthropogenic warming". To illustrate using an example: Mr. Tisdale has a hypothesis, just like the Slayers of the Skydragon have (had?) a hypothesis. Now until Mr. Tisdale succeeds in convincing the scientists who specialize in this area that his ideas have merit, his idea will forever be destined to obscurity and be nothing more than a hypothesis on a climate "skeptic" or climate denier blog.
As for his disappointing excuse not to pursue publishing his ideas in a journal, there is always "Principe Scientfic Intl.". But doing so would not meet the criterion for publishing in a reputable scientific journal. I would dare Mr. Tisdale to publish in J. Climate or JGR-A or GRL or Nature or Science, but then I would be guilty of very likely wasting the valuable time of the editors and busy scientists with Mr. Tisdale's well-intentioned, but misguided ideas. Anyhow, it is telling that he is not up for the challenge, instead invoking conspiracy theories rather than actually submitting a manuscript for review by experts in the field.
On the following, I do not necessarily wholly disagree with Mr. Tisdale, however, scientists have been researching this and publishing their findings in highly respected journals for some time now:
"It’s best to divide the oceans into logical subsets, because coupled ocean-atmospherics processes impact ocean basins in significantly different ways. Realistically, that’s the only way anyone can attempt to perform an attribution study on the warming of ocean heat content data--or sea surface temperature data."
Here is a review of some relevant papers through time on this subject. Note that they all find compelling evidence that the long-term warming of the planet's oceans is primarily externally driven (that is it is primarily the result of higher greenhouse gas levels from human activities). They have found this using sea-surface temperatures, ocean heat content and even salinity. Moreover, they have found the anthropogenic signal both globally and over individual basins. In short, the long-term warming of the planet's oceans is primarily in response to rising greenhouse gas concentrations, not El Nino or ENSO.
To wit:
Sedláček and Knutti (2012,GRL). Two of their key findings:
"Ocean warming of the last century cannot be explained by natural variability
The warming signal is visible throughout the whole ocean"
Gleckler et al. (2012, Nature Climate Change),
"Our detection and attribution analysis systematically examines the sensitivity of results to a variety of model and data-processing choices. When global mean changes are included, we consistently obtain a positive identification (at the 1% significance level) of an anthropogenic fingerprint in observed upper-ocean temperature changes, thereby substantially strengthening existing detection and attribution evidence."
From Pierce et al. (2012),
"We find that observed changes are inconsistent with the effects of natural climate variability, either internal to the climate system (such as El Niño and the Pacific Decadal Oscillation) or external (solar fluctuations and volcanic eruptions). However, the observed changes are consistent with the changes expected due to human forcing of the climate system."
From Santer et al. (2008, PNAS),
"For the period 1906–2005, we find an 84% chance that external forcing explains at least 67% of observed SST increases in the two tropical cyclogenesis regions. "
From
Pierce et al. (2006, J. Climate),
"The observed sampling of ocean temperature is highly variable in space and time, but sufficient to detect the anthropogenic warming signal in all basins, at least in the surface layers, by the 1980s."
From Barnett (2005, Science)
"A warming signal has penetrated into the world's oceans over the past 40 years. The signal is complex, with a vertical structure that varies widely by ocean; it cannot be explained by natural internal climate variability or solar and volcanic forcing, but is well simulated by two anthropogenically forced climate models. We conclude that it is of human origin, a conclusion robust to observational sampling and model differences. "
From Barnett et al. (2001, Science)
"Further, the chances of either the anthropogenic or observed signals being produced by the PCM as a result of natural, internal forcing alone are less than 5%. This suggests that the observed ocean heat-content changes are consistent with those expected from anthropogenic forcing, which broadens the basis for claims that an anthropogenic signal has been detected in the global climate system."
Then again, I do not expect Mr. Tisdale to be swayed by the overwhelming evidence against his idea. But maybe he will surprise us.
Now the roaring forties beckon. - It's El Niño
IanC at 07:35 AM on 26 November, 2012
Bob,
Yes I understand how the PDO index is constructed. The point is that you can get an idea of how the rest of the basin varies by regressing the SST anomaly (SSTA) onto the PDO index to extract the inter-decadal variation that is associated with the PDO. While the PDO index is constructed using N. pacific data, the subsequent regression demonstrate that there is strong evidence that the tropical Pacific ocean vary coherently with the N Pacific.
There are ample evidences of a basin-wide inter-decadal oscillation. Here are two:
Zhang et al. 1997, did an EOF with SSTA of the entire basin . For the low-pass filtered (c.f. fig 3) computation, the dominant mode has a similar spatial structure as the one depicted on the JISAO website. Furthermore, the principal component varies similar to the PDO index.
Shakun and Shaman 2009 showed that if you do a similar analysis with data from the southern Pacific, and the principal component is again highly correlated to PDO index. Furthermore, they again recover similar spatial structure across the entire pacific ocean.
Conclusion is that no matter which way you look at it, there appears to be a robust inter-decadal mode of variability in the pacific. The main point is that although looks like the ENSO, there are two distinctive differences:
- 20-30 years for PDO vs 6-18 months for ENSO.
- ENSO is most prominent in the tropics, while for PDO the responses in N. Pacific and Tropics are similar in amplitdue.
PDO index is one of the ways you can characterize this oscillation, the same way SSTA from a limited region (e.g. NINO3.4) can characterize the state of a basin wide oscillation (ENSO).
Your assertion that the PDO index has no relation to the SSTA is wrong, because one cannot interpret the PDO index (principal component) without concurrently consider the spatial structure (EOF), simply because a mode of variability in an EOF/PC analysis is actually represented by EOF*PC. Here you'll see that you have to choose a normalisation, because if you take c*PC and EOF/c (c is a constant) you get the same thing when you multiple the two together.
Take a look at the EOF and PC for the PDO (from Deser et al. 2010 :

Notice that the units for the top panel (the EOF) is in degrees per standard deviation. The PC (PDO index) is given in standard deviation, so to recover the SSTA you indeed have to multiply the two to get the right units.
The average of the EOF in the N. Pacific definitely negative (<0), but probably no smaller than -0.4. Taking the average you get -0.2 degrees C per SD, which is exactly the scaling factor you found.
You are technically correct in saying that "PDI index is not SSTA", but you are completely missing the point: the PDI index, in conjunction with the EOF, does in fact describe SST variations.
In the eastern pacific (as you defined it), if you average the EOF you probably get 0.3 degree per SD. Between 1980-1985 and 2005-2010, the PDO index went from +1 to -0.5, so
ΔSST= -1.5 * 0.3 = -0.45 degrees C
you can probably argue for a couple of tenths either way, but the key is that the change in eastern Pacific due to PDO is large enough to explain the lack of warming in the eastern pacific.
You said "There’s no flaw in my reasoning or understanding of what causes the PDO. Using different methods, Di Lorenzo came to the same conclusion."
In your blog post, the crux of your argument is fig7, where you plotted 85-month smoothed PDO - Nino3.4 as well as N. Pacific air pressure index (NPI). The figure shows a good correlation between the two series, which you then said "Is The Difference Between NINO3.4 SST Anomalies And The PDO A Function Of Sea Level Pressure?, the answer appears to be yes."
(1) Nowhere in your analysis did you present an argument of causality..
(2) In addition, you applied a 85-month filter, which will likely wipe out any signal in ENSO. In fact if you plot a 85-month smoothed PDO index against the NPI I suspect you will get just as good of a result, so likely what you have found is a good correlation between PDO index and NPI.
Can you post the reference to di Lorenzo?
Final point:
In your original post, you said ‘According to numerous peer-reviewed papers, surface temperatures respond proportionally to El Niño and La Niña events'. I think the reasonable interpretation, based on your wording, is that numerous papers concluded that surface temperatures respond proportionally to El Niño and La Niña events; this is very different from papers assuming the same. - It's El Niño
Bob Tisdale at 15:25 PM on 24 November, 2012IanC: Excuse the delay.
You replied, “You are comparing data with a particular realization of internal variability to data with internal variability filtered out. You are effectively comparing apples to oranges, so of course they look different.”
I assume this is a discussion of the East Pacific data. The appearances are not in question. The trends are.
You replied, “To actually make a sensible analysis, you will at the very least have to look into internal variability of each model run, which entail comparing a large number individual model runs.”
Not me. I’m done with my analysis. It is the responsibility of the party wishing to dispute my results to show the effects of the point that party wants to introduce to the discussion. With that in mind, the models do such a poor job of simulating ENSO you’d be better off trying to remove the effects of ENSO from the East Pacific sea surface temperature data. Then you won’t have to analyze each of the dozens and dozens of model runs. If you don’t want to do that, that’s okay, because the “Rest of the World” data still needs to be explored.
You replied, “To answer your question, a far more plausible explanation is internal variability (e.g. PDO).”
Unfortunately, that explanation doesn’t work for a number of reasons. (a) The PDO represents the standardized leading Principal Component of the sea surface temperature anomalies of the North Pacific north of 20N after the global temperatures have been removed, not the sea surface temperature anomalies. (b) The standardization of the PDO exaggerates its actual variability by a factor of about 5.6, if memory serves. In other words, the standardization exaggerates the importance of the PDO. (c) The PDO is actually inversely related to the sea surface temperature anomalies of that portion of the North Pacific on decadal timescales. (d) The PDO is an aftereffect of ENSO and the sea level pressure of the North Pacific. The sea level pressure of the North Pacific causes the difference between the PDO and ENSO. (e) The dominant component of the PDO is the sea surface temperature of the Kuroshio-Oyashio Extension, in the western North Pacific, not the East Pacific.
You asked, “What scaling and time shifting have you applied to the NINO3.4 data?”
The scaling factor is 0.12 and there’s a 6-month lag.
You asked, “Can you provide references?”
Yup. Every study that attempts to remove the effects of ENSO from the surface temperature record by scaling an ENSO index and by subtracting the scaled and lagged ENSO index from surface temperatures assumes surface temperatures respond proportionally to El Niño and La Niña events. Examples in alphabetical order:
Foster and Rahmstorf (2011) “Global Temperature Evolution 1979–2010”
And:
Lean and Rind (2009) How Will Earth’s Surface Temperature Change in Future Decades?
And:
Lean and Rind (2008) How Natural and Anthropogenic Influences Alter Global and Regional Surface Temperatures: 1889 to 2006
And:
Santer et al (2001), Accounting for the effects of volcanoes and ENSO in comparisons of modeled and observed temperature trends
And:
Thompson et al (2008), Identifying signatures of natural climate variability in time series of global-mean surface temperature: Methodology and Insights
And:
Trenberth et al (2002) Evolution of El Nino–Southern Oscillation and global atmospheric surface temperatures (See note 1)
And:
Wigley, T. M. L. (2000), ENSO, volcanoes, and record-breaking temperatures
Note 1: Trenberth et al (2002) included the following caveat (my boldface):
“The main tool used in this study is correlation and regression analysis that, through least squares fitting, tends to emphasize the larger events. This seems appropriate as it is in those events that the signal is clearly larger than the noise. Moreover, the method properly weights each event (unlike many composite analyses). Although it is possible to use regression to eliminate the linear portion of the global mean temperature signal associated with ENSO, the processes that contribute regionally to the global mean differ considerably, and the linear approach likely leaves an ENSO residual.”
The divergences shown in brown are those ENSO residuals.
Moderator DB asked, “Do you have a link to the specific dataset(s)?”
The Reynolds OI.v2 data is available on a gridded basis through the KNMI Climate Explorer:
http://climexp.knmi.nl/selectfield_obs.cgi?someone@somewhere
And through the NOAA NOMADS website:
The coordinates of the NINO3.4 region are 5S-5N, 170W-120W. The coordinates for the East Pacific is 90S-90N, 180-80W. And the coordinates for the Rest of the World are 90S-90N, 80W-180. I provided a brief introduction to the KNMI Climate Explorer here:
http://bobtisdale.wordpress.com/2010/12/30/very-basic-introduction-to-the-knmi-climate-explorer/
And DB asked, “Is the NINO3.4 data processed in anyway? and if so, how?”
The NINO3.4 sea surface temperature anomalies were scaled by a factor is 0.12, lagged 6 months, and both datasets in the graph of the detrended Rest of the World data were smoothed with 13-month running-mean filters.
Regards
- It's a natural cycle
Eric (skeptic) at 01:32 AM on 5 February, 2012
Thanks Composer99 for pointing to this thread. There are many natural cycles that get discussed on the fringes of science, everything from pure Fourier analysis results (temperature effects with no discussion of cause) to complex orbital or lunar mechanics (causes that generally lack a plausible magnitude of effect). I don't find those very convincing. Instead I would like to put forth a combination of solar, oceanic and AGW (with or without AGC). SkS analyzes each non-anthro cause in separate articles, such as PDO and It's (not) the sun
Those arguments are a divide and conquer approach to GW, including some oversimplification such as using TSI as the primary solar factor. In contrast, I believe GW results from a combination of some natural cycles and AGW. Here is an example of oceanic cycles from http://www4.nau.edu/direnet/publications/publications_m/files/McCabe_etal_2004.pdf showing the NH temperature response to PDO and AMO:
Second, an example of a weather response to solar: http://www.leif.org/EOS/2010GL043091.pdf This is important because the weather controls some climate in general and sensitivity in particular. In this paper, the increase in solar UV is shown to decrease CAPE leading to weaker cyclones. The higher solar cycles of the 80's and 90's (including higher minimums) caused an overall increase in solar UV which caused lower CAPE, weakened tropical cyclones and thus less heat loss to space. The latter is an old and well-established fact (e.g. http://www.dca.ufcg.edu.br/mna/Anexo-MNA-modulo03i.pdf) that increased tropical convection, regardless of cause, will result in more latent heat transfer and cooling. I would then have to show that there was a worldwide decrease in convection, particularly tropical, coinciding with the greatest warming of the 80's and 90's. I do not yet have a good data source for that claim. - What's Happening To Tuvalu Sea Level?
Albatross at 10:11 AM on 28 January, 2012
Rob,
The misguided poster on this thread seems convinced that the reason for the increase in sea level is an increase in the easterly trade winds. This is only partly correct. Research has shown that since the nineties there has been an increase in the strength of the easterly winds in the western tropical Pacific has indeed been partly responsible for the increase in the sea level there-- in fact, SLR in that regions is 3-4 times greater than the global average in that region. But their claim fails to address the bigger picture.
You cite Merrifield (2011). Merrifield published another paper in 2011 on this issue. But first let me set the stage by quoting from Merrifield (2011):
"This sea-level trend shift in the western Pacific corresponds to an intensification of the easterly trade winds across the tropical Pacific. The wind change appears to be distinct from climate variations centered in the North Pacific, such as the Pacific Decadal Oscillation....The shifts in trade wind strength and western Pacific sea level rate resemble changes in dominant global modes of outgoing longwave radiation and sea surface temperature. It is speculated that the western Pacific sea level response indicates a general strengthening of the atmospheric circulation over the tropical Pacific since the early 1990s that has developed in concert with recent warming trends."
So this paper suggests a positive feedback associated with global warming, with a general increasing trend in sea-level being amplified over the western tropical Pacific due to changes in the wind field possibly associated with AGW.
Merrifield and Maltrud (2011) published another paper on this issue. This paper was highlighted in the EOS newspaper and they summarize the implications of the paper's findings as follows:
"...using a general circulation model, Merrifield and Maltrud show that western tropical Pacific sea level trends are likely due to a gradual intensification of the Pacific trade winds in the past 2 decades. They also highlight other aspects of ocean circulation that have been altered in response to the intensifying trade winds. Some previous research has suggested that the trade wind intensification is a result of global warming, although that has yet to be verified. If that is the case, the authors conclude the western tropical Pacific sea level trends will likely continue to be anomalously high."
Even if the trade winds do moderate, things are not looking good for Tuvalu, and down the road they could face serious issues during La Nina years when the long-term underlying trend will be amplified when water piles up in the western equatorial Pacific. In fact, they may be already experiencing problems on account of the current prolonged La Nina. - Puget Sound, Under Threat From Ocean Acidification, Put on "Waters of Concern" List
Rob Painting at 16:19 PM on 16 January, 2012
Pirate - the acidification of the ocean right along the North American Pacific coast will be discussed in detail in an upcoming post. But that will be a couple of weeks away.
You're right about being short on information - but the point of this re- post was to highlight the fact that the authorities had to be dragged along to court to acknowledge the problem. Oyster larvae started dissolving and dying 6 years ago from corrosive seawater.upwelling into the sound, and so far their response has been the all too familiar "heads in the sand' approach.
Quite ironically part of the problem is intensified seasonal upwelling along the coast due to global warming. The strengthening winds lead to greater upwelling of corrosive deep water. This will be moderated depending on what phase the PDO (Pacific Decadal Osciallation) is in, but the source of the upwelling is water that was last at the surface around 40 years ago. In other words it will, most likely, progressively worsen. - UAH Misrepresentation Anniversary, Part 2 - Of Cherries and Volcanoes
Tom Curtis at 09:51 AM on 28 December, 2011
DaneelOlivaw @1, not only do Foster and Rahmstorf 2011 show that neither the sun, volcanoes or the El Nino Southern Oscillation (or any combination of them) are responsible for the current warming; they also show that what ever is responsible has had a near constantly increasing effect over the last 33 years. So which mythical natural cause of global warming has that property?
Not the Atlantic Multidecadal Oscillation:

Not the Pacific Decadal Oscillation:

Not Cosmic Rays:

F&R2011 not only show the effects of short term variations in ENSO, etc. By doing so they also show that the remaining long term trend is inconsistent with all the favourite fake skeptic "natural" explanations leaving anthropogenic forcing as the only currently proposed mechanism consistent with the data. It follows that R&F2011 is strong evidence that the current warming is due to anthropogenic forcings. - Foster and Rahmstorf Measure the Global Warming Signal
Tom Curtis at 23:08 PM on 20 December, 2011
skept.fr @24, as you correctly not Tamino (Foster) discusses the Atlantic Multidecadal Oscillation (AMO) on his blog. He has shown that the AMO is just detrended North Atlantic Sea Surface Temperature (SST) Anomaly, and that there is little evidence of anything more (your link). However, he has also shown that there is no statistically significant evidence of quasiperiodicity in the variations in North Atlantic SST of over the last 6000 years. He has also shown that the AMO lags temperatures land temperatures, rather than leads them, arguing against a causal role for the AMO.

In his words:
"Now the peak correlation is at lag -2 months (again temperature leads AMO) and the difference from the lag 0 correlation is larger. I think this suggests two things. First, ... Second, the argument against causality from AMO to temperature is stronger. It’s still very weak — but based only on the time series, the argument for causality is even weaker."
In fact, rather than causality, I would suggest the lag is simply a consequence of the quicker response time of land surface temperatures relative to SST for a given forcing.
With regard to the Pacific Decadal Oscillation (PDO), when Tamino first performed this analysis for his blog, the PDO was brought up in comments, so Tamino regressed against the PDO as well. The PDO did not show any significant effect. I believe only the AMO and PDO have been suggested as causes of a (purportedly) spurious anthropogenic warming signal by deniers.
As a side note, AO is often used to refer to the Artic Oscillation, so its use to refer to Atmosphere/Ocean circulations while discussing various oceanic "oscillations" can be confusing. - 2009-2010 winter saw record cold spells
muoncounter at 09:39 AM on 31 October, 2011
A new study (Sept 2011) confirms and extends the thesis of this post to winter 2010-2011. Link to pdf.
Recent warm and cold daily winter temperature extremes in the Northern Hemisphere
While some parts clearly experienced very cold temperatures, the NH was not anomalously cold. Extreme warm events were much more prevalent in both magnitude and spatial extent. Importantly, the persistent negative state of the North Atlantic Oscillation (NAO) explained the bulk of the observed cold anomalies, however the warm extremes were anomalous even accounting for the NAO and also considering the states of the Pacific Decadal Oscillation (PDO) and El Niño Southern Oscillation (ENSO). These winters’ widespread and intense warm extremes together with a continuing hemispheric decline in cold snap activity was a pattern fully consistent with a continuation of the warming trend observed in recent decades.
-- emphasis added - Ocean Heat Poised To Come Back And Haunt Us?
Karamanski at 09:16 AM on 16 October, 2011
It doesn't make any sense how more rain over land would cool global surface temperatures during La Nina and how less rainfall over land would warm global surface temperatures during El Nino.
I was also wondering what cycle governs when hiatus periods occur. Is it the Pacific Decadal Oscillation, or increased frequency of La Ninas? - The Deep Ocean Warms When Global Surface Temperatures Stall
Rob Painting at 06:21 AM on 7 October, 2011
Utahn - once heat is buried into the very deep ocean it stays there for hundreds to thousands of years, before it can be recycled back to the surface. Think of those orange-coloured ocean areas in figure 4 acting as funnels taking heat down to the deep. Once the heat is way down deep, it isn't coming back out anytime soon.
Meehl (2011) suggest that natural variability, which affects the ocean surface layers especially, is what causes the hiatus periods. During the La Nina-like phase (or negative Interdecadal Pacific Oscillation) more cool water upwells to the surface (particularly in the tropical Eastern Pacific), and because the ocean surface is so large and responsible for much of the heating of the atmosphere, this cools the surface temperature on a global scale.
At the same time, because the ocean is heated by sunlight and, due to the funneling of heat down to the depths in those mid-latitude regions, the oceans as a whole accumulate heat during these La Nina-like hiatus phases.
Although Meehl (2011) doesn't dwell on the opposing phase of this natural cycle, figure 2 shows that they are times of sharp rises in global surface temperature - which suggests a more El Nino-like response from the ocean. Just for clarification: during El Nino the upwelling of cold water in the tropical Eastern Pacific shuts off and the surface layers warm. It's this shuffling of heat between the surface and subsurface ocean layers (in the top 500 metres of ocean) which directly affects global surface temperatures, not heat from the deep ocean.
As for OHC and climate sensitivity, that's a discussion for another day. I'll get around to that. In the meantime, I hope this is all a little bit clearer. We'll have to wait and see if the climate modeling-based mechanism in this paper is supported by the observations. - It's Pacific Decadal Oscillation
Bob Lacatena at 02:11 AM on 23 July, 2011
106, Eric the Red,
If you have not already done so, I very, very, very strongly suggest that you go read:
Blaiming the Pacific Decadal Oscillation
post here on Skeptical Science (from March 5, 2011).
It contains a lot of information that you'll find useful, including, most importantly, a (failed) effort by Dr. Roy Spencer to attribute current warming to the PDO.
Please read it thoroughly. I also suggest following the links to actually read the source papers, in particular Schneider et Al (2005). - It's Pacific Decadal Oscillation
Eric (skeptic) at 21:23 PM on 15 July, 2011
barry, thanks for explaining the distinction between the centenial (mostly secular) and decadal (mostly oscillatory) trends. I believe most of the fluctuation in the secular AGW trend can be explained with natural oscillations. There do not seem to be very strong long term natural trends at the moment. Specifically warming accelerated in the 80's and 90's and decelerated in the 00's.
I can also answer my question from January, the La Nina was strong, especially in its effects on the continental US stemming from abnormally cold Pacific temperatures. Those effects still linger, but the La Nina has ended. However it is predicted to return, not good news for drought-stricken Texas and rain-soaked Montana. - Why Wasn't The Hottest Decade Hotter?
scaddenp at 12:00 PM on 15 July, 2011
The proper thread would be Its the PDO. PDO is basically an index whereas ENSO is a physical system. There is some evidence that PDO may be long-lived integrator of the ENSO cycle. See the linked article. - Trenberth on Tracking Earth’s energy: A key to climate variability and change
Ken Lambert at 13:00 PM on 14 July, 2011
David Lewis & Rob Painting
Dr Trenberth has generously given his time to answer queries by private email in the past - so if he is travelling in AU/NZ we can only hope he can find time to answer questions on this thread.
Regarding this quotation from above post:
"In the meantime, we have explored the extent to which this kind of behavior occurs in the latest version of the NCAR climate model. In work yet to be published (it is submitted), we have found that energy can easily be “buried” in the deep ocean for over a decade. Further preliminary exploration of where the heat is going suggests that it is associated with the negative phase of the Pacific Decadal Oscillation and/or La Niña events."
Without seeing the yet to be published paper, it seems this 'heat burial' would raise a number of further questions:
1. What is the physical mechanism for getting heat down into the deep oceans (below 700m? or 2000m?) in short time frames - a few years?
2. Over a decade - why not 2 or 3 decades or 50 years? Heat buried from prior to the 'official' start of AGW in 1975 could be re-appearing to warm the surface. Would that be caused by AG forcings or the Sun?
3. Again my question from #31 about whether the ENSO-La Nina cycles are 'internal' redistributions of global heat already within the system or are external global forcings which should be added to the RF and climate response terms to determine an imbalance?
Unless I am misreading the scale in DL #43 graphic - the depth of ENSO-LaNina 'sloshing of heat' is 300-600ft (100-200m)- hardly related to the deep oceans. - Trenberth on Tracking Earth’s energy: A key to climate variability and change
Arkadiusz Semczyszak at 21:02 PM on 13 July, 2011
@Rob Honeycutt
Aerosols are mainly India + Pakistan and others are rapidly developing poor countries of Africa and Asia (the use of simple reserves) - not China.
I do not “believe” in “... that some unknown systematic error in the Argo float system is causing the flattening ...”.
Recently I analyze an interesting paper The HadGEM2-ES implementation of CMIP5 centennial simulations, Jones et al. 2011. (36 coauthors) : I like the Figure 20 there (but also a Figure 19 - of course ...)
... and the chapter begins with this fragment:
“Extensive evidence exists from previous long control simulations showing simulated climate possesses large-scale variations on decadal to centennial timescales (Delworth et al., 1993; Delworth and Mann, 2000; Latif et al., 2004; Knight et al., 2005). Typically, these variations are associated with the principal modes of decadal variability of the climate system – the Atlantic Multidecadal Oscillation (AMO) (Enfield et al., 2001) and the Pacific Decadal Oscillation (PDO), sometimes referred to as the Interdecadal Pacific Oscillation (IPO) (Power et al., 1999). The AMO is a North Atlantic-centred mode in which sea surface temperatures (SSTs) vary coherently within the basin on multidecadal to centennial timescales, and which can have far reaching climate impacts (Knight et al., 2006). The PDO/IPO has a characteristic pattern of anomalously warm and cool SSTs in the Pacific Ocean that resembles a modified El Ni˜no pattern, and typically has a shorter timescale of about two decades (Kwon and Deser, 2007). So-called “perfect model” experiments (Collins and Sinha, 2003), in which sections of model control simulations are repeated after small initial perturbations, demonstrate the potential for multidecadal oceanic processes to provide a long-term memory of the initial state.”
... and ending with this sentence:
“Future work may explore the response of extra ensemble members which start from deliberately chosen high or low AMO states.”
Maybe in a much larger change in energy content in the ocean is responsible underestimated AMO? But then earlier (195? -1999) energetic "effect anthropogenic" would be considered too highly estimated ...
I think it's time for these "Future work” ... - Linking Extreme Weather and Global Warming
Tom Curtis at 11:59 AM on 19 June, 2011
Badgersouth @51, a search on google scholar for the terms ENSO & ("global warming" v "climate change") 2009 or later produces the following articles of interest:
Models:
Latif and Keenlyside, "El Niño/Southern Oscillation response to global warming", PNAS 2008
Collins et al "The impact of global warming on the tropical Pacific Ocean and El Niño" Nature Geoscience 2011
Both indicate that models disagree about the effects of global warming on the ENSO.
Historical:
Gergis and Fowler "A history of ENSO events since A.D. 1525: implications for future climate change" Climatic Change 2008
Gergis and Fowler indicate a significant anthropogenic effect on El Nino intensities:
"Although extreme ENSO events are seen throughout the 478-year ENSO reconstruction, approximately 43% of extreme and 28% of all protracted ENSO events (i.e. both El Niño and La Niña phase) occur in the 20th century. The post-1940 period alone accounts for 30% of extreme ENSO years observed since A.D. 1525. These results suggest that ENSO may operate differently under natural (pre-industrial) and anthropogenic background states."
Doran et al "Analyzing ENSO Period Changes in a Proxy Record Spanning the Last Millennium" Geophysical Research Letters 2009
Doran et al indicate a change in the frequency of ENSO shifts:
"The time series model analysis of the Palmyra corals shows ENSO period changes
that are similar to the broad patterns observed in the wavelet analysis (Figure 2). ENSO
periods are generally higher during the pre-1850 interval (μ = 6.4 years, σ = 1.9 years, N
= 9), while periods post-1850 are lower (μ= 4.0 years, σ = 0.60 years, N = 4). This 2.4-
year decrease in ENSO period from pre-1850 to post-1850 is statistically significant (p <
0.1). In particular, three of the four estimated ENSO periods in the post-1850 interval are
at or below the lower limit of periods observed pre-1850. Additionally, there is a shift in
ENSO period at 1700 that is more pronounced than the shift observed at 1850. This
earlier shift may reflect changes in forcing, such as increased volcanic activity..."
Li et al "Interdecadal modulation of El Niño amplitude during the past millennium" Nature Climate Change 2011
Li et al conclude that warmer conditions are correlated with enhanced ENSO variability, a finding in agreement with Doran et al.
I am making no claim to expertise, so I can't say that these studies are representative, and for most of them I have read only the abstract so I can't comment on their validity. They are, however, consistent with the evidence as I have seen it summarized. - Are you a genuine skeptic or a climate denier?
scaddenp at 14:12 PM on 8 June, 2011
Eric the Red, perhaps you should look at this post . - Is the CRU the 'principal source' of climate change projections?
Stephen Baines at 07:17 AM on 17 May, 2011
Reading between the lines a bit, but I think nanjo seems to be arguing that CO2 won't increase according to the projections because the ocean is cooling. This argument could be (not certain, though) a variation on the Co2 is coming from the ocean meme. That is, the post industrial increase in CO2 is not from humans but from the ocean which is warming for other inscrutable reasons.
Wow. Talk about a house of cards. - Solar Hockey Stick
Arkadiusz Semczyszak at 23:52 PM on 14 April, 2011
Sorry , my fault,
A few citations, which recently I put on this site:
Sub-Milankovitch solar forcing of past climates: Mid and late Holocene perspectives, Helama et al., 2010.:
“The observed variations may have occurred in association with internal climate amplification (likely, thermohaline circulation and El Niño–Southern Oscillation activity). THE NEAR-CENTENNIAL DELAY in climate in responding to sunspots indicates that the Sun's influence on climate arising from the current episode of high sunspot numbers may not yet have manifested itself fully in climate trends.
Testing solar forcing of pervasive Holocene climate cycles, Turney et al., 2005. :
“The cycles, however, are not coherent with changes in solar activity (both being on the same absolute timescale), indicating that Holocene North Atlantic climate variability at the millennial and centennial scale is not driven by a linear response to changes in solar activity.”
Cyclic variation and solar forcing of Holocene climate in the Alaskan subarctic, Hu et al., 2003.:
“Our results imply that small variations in solar irradiance induced pronounced cyclic changes in northern high-latitude environments. They also provide evidence that centennial-scale shifts in the Holocene climate were similar between the subpolar regions of the North Atlantic and North Pacific, possibly because of Sun-ocean-climate linkages.”
Response of Norwegian Sea temperature to solar forcing since 1000 A.D., Sejrup,2010.:
“The correlations are synchronous to within the timescale uncertainties of the ocean
and solar proxy records, which vary among the records and in time with a range of about
5–30 years. The observed ocean temperature response is larger than expected based on
simple thermodynamic considerations, indicating that there is dynamical response of
the high‐latitude ocean to the Sun.”
Swingedouwet al., 2010. lag TSI - temperature - 40-50 years - regional NH.
The influence of the de Vries (∼200-year) solar cycle on climate variations: Results from the Central Asian Mountains and their global link, Raspopov et al. 2006.:
“An appreciable delay in the climate response to the solar signal can occur (up to 150 years). In addition, the sign of the climate response can differ from the solar signal sign. The climate response to long-term solar activity variations (from 10s to 1000s years) manifests itself in different climatic parameters, such as temperature, precipitation and atmospheric and oceanic circulation.”
Mid- to Late Holocene climate change: an overview
Wanner et al., 2008: „On decadal to multi-century timescales, a worldwide coincidence between solar irradiance minima, tropical volcanic eruptions and decadal to multi-century scale cooling events was not found..”
Medieval Climate Anomaly to Little Ice Age transition as simulated by current climate models, González-Rouco et al., 2011.:
“Therefore, under both high and low TSI change scenarios, it is possible that the MCA–LIA reconstructed anomalies would have been largely influenced by internal variability. ”
Climate change and solar variability: What's new under the sun?, Bard and Frank, 2006.:
“Overall, the role of solar activity in climate changes — such as the Quaternary glaciations or the present global warming — remains unproven and most probably represents a second-order effect.” - Blaming the Pacific Decadal Oscillation
Timothy Chase at 09:57 AM on 7 March, 2011
RW1 wrote in 47:All I'm saying is if natural oscillations (variations) can cause up to 0.5 C of temperature change in one year, why couldn't natural forces cause most of the 0.6 C of warming over the whole of 20th century?
I believe the subject of this post is the climate oscillation known as the Pacific Decadal Oscillation. Climate oscillations like the Pacific Decadal Oscillation store energy, release it, get recharged then release it again. El Nino is a classic example of this.
Just after an El Nino temperatures go up due to the energy that is released into the atmosphere. Then temperatures go down. Climate oscillations are responsible for much of the year to year natural variability in temperature.
Another source is solar insolation. But we know that but for the solar cycle output has been flat to falling since at least 1962 thanks to satellite measurements.
Climate oscillations can't create energy. They can only store it then release it. The sun hasn't been producing additional energy. Where is the energy for your natural variability being the "cause most of the 0.6 C of warming over the whole of 20th century" supposed to come from?
We know that CO2 absorbs thermal radiation. We are able to easily demonstrate this in a lab. See the "CO2 Experiment" video at the top of this page.) We have known this since the mid 1800s. We are able to measure the absorption spectra of carbon dioxide and other greenhouse gases.
We know that in terms of its greenhouse effect carbon dioxide acts primariyly in the region of the spectra centered around 15 μm (15 microns), a wavenumber of 667 cm-1 that is due to the quantized bending mode of the molecule -- which acts in accordance with the principles of quantum mechanics to result in the absorption of radiation in this part of the spectra. We know that absorption keeps going up as you raise the levels of carbon dioxide.
Using satellites we are able to image atmospheric carbon dioxide. We are able to see the plumes rising up from the heavily populated East and West coasts of the United States. We can image the carbon dioxide because it reduces the rate at which infrared radiation escapes to space.
If energy is escaping the climate system at a reduced rate but entering the climate system at the sate rate as before we know that the amount of energy in the system has to increase. We know that the temperatures have to increase.
We know that for every degree Celsius you increase the temperature the humidity of saturation has to increase by 8%. We know that for every 10°C it roughly doubles. And we know that water vapor absorbs radiation, just like carbon dioxide, and are able to satellite image that, too. Water vapor doesn't condense to form clouds unless it exceeds the humidity of saturation -- and the humidity of saturation increases with temperature. By a factor of 2 for every 10°C.
RW1 wrote in 47:The bottom line, for me at least, is net positive feedback is an extraordinary claim that requires extraordinary proof, especially since solar energy is not amplified to anywhere near such an extent and since net negative feedback is far, far more logical for a system stable enough to support life as the Earth is.
"... especially since solar energy is not amplified to anywhere near such an extent." It is amplified to roughly the same extent. We can't explain the warm interglacials and ice ages without the amplification due to carbon dioxide (which is released by the oceans when they warm like a warming soda losing its fizz but absorbed when the oceans cool), ice sheets (due to their melting and growth) and water vapor feedback.
"... net negative feedback is far, far more logical for a system stable enough to support life as the Earth is."
Have you ever heard of the Permian/Triassic Extinction? Nearly all life as we know it was wiped out when a flood basalt supervolcano erupted, sending vast quantities of carbon dioxide into the atmosphere. We won't likely reach that level but something resembling the Paleocene-Eocence Extinction may be within our reach. - Blaming the Pacific Decadal Oscillation
Chief Hydrologist at 18:35 PM on 6 March, 2011
It should rather be the Interdecadal Pacific Oscillation -because it is a basin wide multidecadal phenomenon that acts through modulation of the intensity and frequency of ENSO.
Cloud cover changes in the tropical and subtropical regions are most strongly influenced by sea surface temperature. SST is most strongly influenced by ENSO+PDO. Observational evidence shows cloud cover and optical depth decreasing following the great Pacific climate shift in 1976/1977 to the late 1990's and increasing thereafter (Burgmann et al 2008, Clements et al 2009, Norris 2005) - consistent with these multidecadal changes in SST.
These changes are consistent with the trends of ERBS, ISCCP and HIRS radiative flux data showing a decreasing trend in reflected shortwave and an increase in emitted longwave from the mid 80's to the late 1990's.
There seems to have been a decrease in Pacific cloud cover in the late 1970's and an increase in the late 1990's - which if you anywhere near accept the quantum of the satellite data dominated warming in the period.
I do have a recent post here - http://judithcurry.com/2011/02/09/decadal-variability-of-clouds/ - Blaming the Pacific Decadal Oscillation
Timothy Chase at 09:34 AM on 6 March, 2011
Bob Tisdale wrote:The difference in the multdecadal variability of ENSO (NINO3.4 SST anomalies as a proxy) and the PDO should be a function of North Pacific Sea Level Pressure...
It's not eye balling as they use statistics, but you might be interested in
Di Lorenzo et al. (2010 ) ENSO and the North Pacific Gyre Oscillation: an integrated view of Pacific decadal dynamics (presented at AGU 2010 Ocean Sciences Meeting) nevertheless. - Blaming the Pacific Decadal Oscillation
Timothy Chase at 07:21 AM on 6 March, 2011
Sometimes I think the language used to describe "climate oscillations" is somewhat unfortunate. To many the term "oscillation" suggests periodic behavior. This is compounded by references to "climate oscillation's" "period." But the behavior of climate oscillations is generally not periodic. Instead there is a characteristic time scale that appears to be associated with a form of bistability where the system tends to be in either one state or the other. Your reference to "atmospheric noise" is suggestive of the nonperiodic nature of the Pacific Decadal Oscillation's non-periodic, or alternatively, quasi-periodic behavior.
The Pacific Decadal Oscillation has a couple of characteristic time scales. Atmoz gives a detailed explanation of the correlation between PDO and global temperature in which he mentions two different characteristic time scales:Sometimes, it's said that the PDO has a characteristic time scale, hence the word decadal in the acronym. The UW website states that "Shoshiro Minobe has shown that 20th century PDO fluctuations were most energetic in two general periodicities, one from 15-to-25 years, and the other from 50-to-70 years." To evaluate this, we can look at a wavelet analysis of the PDO with trend derived in the first part of this post.
The longer characteristic time scale is comparable to that which presumably exists for the Atlantic Multidecadal Oscillation.
On the Relationship between the Pacific Decadal Oscillation (PDO) and the Global Average Mean Temperature
Atmoz, 3 Aug 2008
http://atmoz.org/blog/2008/08/03/on-the-relationship-between-the-pacific-decadal-oscillation-pdo-and-the-global-average-mean-temperature(emphasis added)
Please see:Michael E. Mann, associate professor of meteorology and geosciences, Penn State, and Kerry A. Emanuel, professor of atmospheric sciences, MIT, looked at the record of global sea surface temperatures, hurricane frequency, aerosol impacts and the so-called Atlantic Multidecadal Oscillation (AMO) — an ocean cycle similar, but weaker and less frequent than the El Nino/La Nina cycle. Although others have suggested that the AMO, a cycle of from 50 to 70 years, is the significant contributing factor to the increase in number and strength of hurricanes, their statistical analysis and modeling indicate that it is only the tropical Atlantic sea surface temperature that is responsible, tempered by the cooling effects of some lower atmospheric pollutants.
Shorter characteristic time scales would be suggestive of oscillators associated with shallower ocean ocean phenomena that would be more easily influenced by interactions between the atmosphere and ocean whereas longer characteristic time scales suggest that bistability involves changes in deepwater ocean circulation.
Climate change responsible for increased hurricanes
Tuesday, May 30, 2006
http://live.psu.edu/story/18074(emphasis added)
In addition to the correlation between PDO and ENSO phases over time you have the fact that the two are virtually identical in spatial distribution but for the fact that PDO is strongest in the North Pacific whereas ENSO is strongest in the Equatorial Pacific. But during their warm phases both are cool in the North Pacific and warm in the Equatorial Pacific.
You can see this here:
Figure 1 Warm Phase PDO and ENSO.
http://cses.washington.edu/cig/figures/pdoensoglobe_BIG.gif... from:
The Pacific Decadal Oscillation
http://cses.washington.edu/cig/pnwc/aboutpdo.shtml
So there is a bit more to go on than simply a temporal correlation between two scalar values. What we have is an areal and temporal correlation between two two-dimensional fields that vary over time.
Essentially, over the entire area of an ENSO, the warm phase of the PDO would appear to result in constructive interference with the warm phases of ENSO and destructive interference with ENSO’s cool phases, whereas the cool phase of PDO results in deconstructive interference with the warm phases of ENSO and constructive interference with ENSO’s cool phases. So it shouldn’t be any surprise at all that El Ninos are typically stronger, longer and more frequent during the warm phase of PDO and La Ninas are typically stronger, longer and more frequent during the cool phase of PDO.
Spatial destructive interference might also help to explain the existence of a lead-lag relationship where an El Nino will tend to cause the Pacific Decadal Oscillation to tip from its negative phase to its positive phase. Feedbacks, both positive and negative, are part of an integrated theory of ENSO put forward in:
Chunzai Wang (March 2001) On the ENSO Mechanisms, Advances in Atmospheric Sciences (Special Issue)
Such feedbacks no doubt result in much of the observed quasi-stability of PDO states and would help to explain the observed lead-lag relationship between El Nino and the Pacific Decadal Oscillation, e.g., an El Nino weakening or overwhelming the negative phase of the Pacific Decadal Oscillation, making it easier for the latter to switch to its positive phase.
Positive feedbacks no doubt help to explain the quasi-stability of the two states of the Pacific Decadal Oscillation. An El Nino may weaken or even overwhelm the negative phase of the Pacific Decadal Oscillation, making it easier for the mode to slip from its negative phase to its positive phase.
PDO lags ENSO on the scale of several months:ENSO also leads the PDO index by a few months throughout the year (Fig. 1d), most notably in winter and summer. Simultaneous correlation is lowest in November–March, consistent with Mantua et al. (1997). The lag of maximum correlation ranges from two months in summer (r ~ 0.7) to as much as five months by late winter (r ~ 0.6).
... and several years:
Matthew Newman et al (1 Dec 2003) ENSO-Forced Variability of the Pacific Decadal Oscillation, Journal of Climate, Vol 16, No 23There is potential a lead-lag relationship between the time variability of PDV2(i.e., the PC time series of PDV2) and N34Var although it does not exceed a statistical significance test. Figure 5c shows the lagged correlations of N34Var with the PC of PDV2. Note that the thick line indicates the 95% significant level and negative lags indicate the N34Var preceding the PC of PDV2. The maximum correlation occurs at lags of approximately 3~4 years with positive correlation. This indicates that the N34Varleads the variability of PDV2, suggesting that the Pacific mean state, which is identified by the PDV2, is due to a residual associated with larger or small ENSO amplitude.
Sang-Wook Yeh and Ben P. Kirtman (May, 2004) Pacific Decadal Variability and ENSO Amplitude Modulation - Roy Spencer’s Great Blunder, Part 2
From Peru at 10:37 AM on 2 March, 2011
Re:#6.michael sweet
Thanks you for the link to the wiki article showing how deep the anti-scientific beliefs of Roy Spencer reach.
Roy Spencer accuse climate scientists of a "Great Blunder" in which he blames recent warming on ocean cycles like PDO and ENSO instead of greenhouses gases.
He is dead wrong because in the past, the ENSO-PDO climate connection brokes down: during the so-called Medieval Warm Period, the Tropical Pacific was in a protracted COOL state, dominated by a NEGATIVE PDO:
Variations in the Pacific Decadal Oscillation over the past millennium
And a LA NIÑA protracted dominance:
Fossil coral snapshots of ENSO and tropical Pacific climate over the late Holocene
Proving that radiative forcing (in the case of the MWP, solar + volcanic) is by far the main driver of climate, not internal oceanic oscillations like ENSO and PDO like people like Roy Spencer want us to believe.
Saying all this, I can also show that Roy Spencer, not having enough with spreading nonsense about the climate science, it is an advocate of a pseudoscience far worse than climate "skepticism": intelligent design, that is just a Trojan Horse for Creationism (or as can be described better, evolution denialism).
The wiki page given by michael sweet links to this "gem" written by Roy Spencer in the right-wing magazine TCS daily:
Faith-Based Evolution
The nonsense seen here can be quoted:
"Twenty years ago, as a PhD scientist, I intensely studied the evolution versus intelligent design controversy for about two years. And finally, despite my previous acceptance of evolutionary theory as "fact," I came to the realization that intelligent design, as a theory of origins, is no more religious, and no less scientific, than evolutionism."
"While similarities between different but "related" species have been attributed by evolutionism to common ancestry, intelligent design explains the similarities based upon common design. An Audi and a Ford each have four wheels, a transmission, an engine, a gas tank, fuel injection systems ... but no one would claim that they both naturally evolved from a common ancestor."
Can we trust a "scientist" that wrote such a piece of disinformation?
This is not a matter of religious beliefs. The problem here is that he believes that "intelligent design" is a valid scientific theory and should be teached alongside mainstream evolution.
This is just crazy. Strange that many climate "skeptics" are also evolution "skeptics". I suspect an ideological, right-wing common root on both positions. - Hockey Stick Own Goal
muoncounter at 06:23 AM on 24 February, 2011
Protestant, Apparently you do not understand the meaning of 'oscillation'? Consider finding the area under a sine curve over a full period; you always obtain 0.
"Why do both, AMO and PDO STRONLGY correlate with temperatures?"
Wow, then that must mean that correlation = causation? Thanks, we can use that basic principle to demonstrate CO2 -> increased temperature.
For the lack of any long term effects due to the PDO, see the appropriate thread. Short answer: Ocean circulation moves heat around; it doesn't add heat. It is a response to a pre-existing non-uniform heat distribution. You really shouldn't need to see a link for that.
This is not an oscillation thread; further oscillation discussion should go to the appropriate thread. - Guardian article: Australia's recent extreme weather isn't so extreme anymore
johnd at 12:17 PM on 12 February, 2011
Albatross at 04:02 AM on 12 February, 2011, regarding the Gallant and Karoly paper you recommended, whenever I see such analysis I always consider how or why the beginning and ending points have been selected as often it becomes apparent that such points often sets a stage that puts a bias on the outcome, especially when considering trends.
The year 1911 was at the end of 3 consecutive La-Nina years with the IPO (Inter-decadal Pacific Oscillation) in the midst of a relative short negative (wetter) phase, with SOI reaching a value of 16.
Three longer phases of the IPO subsequently occurred during the 20th century, a positive (dryer) phase (1922-1944), a negative (wetter) phase (1946-1977) and another positive (dryer) phase (1978-1998) with another change of phase in the process of forming since then.
The year 1957 in the midst of long negative (wetter) phase happened to be an El-Nino year preceded by again 2 consecutive La Nina years during which the SOI value again peaked at about 16.
Therefore before one can conclude that something very different is going on, other than some short term aberrations, one needs to consider if the beginning and ending points of the study were firstly moved back, say a nominal one decade, and then secondly moved forward one decade, would the same conclusions be reached.
A matter of further interest regarding the recent floods is that
PROFESSOR Stewart Franks, a hydrologist at NSW's University of Newcastle, warned in a peer-reviewed scientific article published in 2006 that the risk of serious flooding in southern Queensland and NSW increases significantly when a negative phase of the Interdecadal Pacific Oscillation corresponds with a La Nina event. - A Case Study of a Climate Scientist Skeptic
protestant at 03:05 AM on 5 February, 2011
All of that 0,8C is not made by CO2 thats just an assumption taken from the climate models ,which actually do not replicate the 1940 hump. A great of warming (specially post 1970) is from the Atlantic Multidecadal Oscillation (AMO) and the Pacific Decadal Oscillation (PDO). AMO has also been recently discussed in the scientific literature by Delsole et al contributing circa 0.08K/decade to the trend. The recent flattening of the rise is consistent with this explanation.
Then you have to prove that there is no decaedal natural variability (almost evident and the oscillations can be seen in paleo records too), or that this variability is due GHG's (nonsense, since CO2 was almost constant pre industrial). Natural climate variability has always existed and it didnt suddenly just disappear. Whether it is internal or caused by clouds (North Atlantic temperatures correlate very well against Solanki et al at least for the last couple of hundred years), both occasions will seal the CAGW case. - Could global warming be caused by natural cycles?
WHATDOWEKNOW at 05:07 AM on 19 January, 2011
#155. Please see my previous comment (#151). The current la nina is NOT the strongest on record. Current SST anomalies are about the same (0.1C lower) than the 2008 La Nina which was the weakest "peak" la nina since 1975 and the lowest "peak" la nina since 1950. (unfortunately I can't past a pictures here, otherwise you'd see exactly what I mean, but I can refer to my another post to give you an idea: here; #13.
Now, time will tell if the current la nina will get any or much stronger, though most indications don't point that way.
Also, and as I pointed out previously, global temperatures LACK 3-6months behind in response to ENSO events. Hence, most of the atmosphere won't respond until right around now... - Could global warming be caused by natural cycles?
WHATDOWEKNOW at 12:54 PM on 18 January, 2011
Interesting discussion, but I didn't see much discussion about the ENSO/NOI/SOI cycle, which is one of the most well-known natural oceanic cycles (is it a cycle?). There are, however, one or two posts stating that the ENSO cycle only causes short term effects and the net-energy balance is zero (e.g. comment #22). However, that would only be the case if el ninos and la ninas were of the exact same magnitude, same volume, and occur over the same length of time. If not, there will be an energy imbalance: more and stronger el ninos over time compared to la ninas will cause more heat to be released and vice versa.
I have posted here how the PDO and ENSO cycle are linked, and how el ninos have increased in number and strength compared to simultaneously -and at the exact same rate- decreasing la ninas (both in nr an strength) over the last few decades.
To be more specific: looking at the NOI data the last decade (2000-2011) has been dominated by el ninos: 37 el nino months vs. 26 la nina months (including the current la nina), whereas the years prior to the last decade (1950-2000) it was the other way around: 145 el nino months vs 175 la nina months. For the entire data-record (1950-2011), la ninas still dominate: 200 la nina months vs 182 el nino months. However, since 1975 (about the year that is often found since when global atmospheric temperatures started steadily increasing) el ninos have dominated both in number of months and peak-strength: 120 el nino months vs. 93 la nina months, with an average strength of +1.1 +/- 0.5 and -1.0 +/- 0.4, and a an absolute peak strength of 2.5 and -1.9, respectively. Hence, not only were there 12% more el nino months, these were also on average 10% stronger, compared to la ninas during the same time period. In addition, the peak el nino (1998), being 24% stronger than the peak la nina (1988). This trend-reversal from a la nina dominated to an el nino dominated cycle got even stronger in the last decade, which interestingly is also the warmest decade on record. Now I am NOT saying the ENSO cycle can explain all global warming since the 1970s/1980s, certainly NOT, but the ENSO cycle can -given its developments over the last few decades- not be dismissed as having no effect by the simple statement that "they -el ninos and la nina- cancel each other out", as they clearly haven't over the last decade and last 3 decades for that matter.
ps: please don't plot CO2 levels using a y-axes from say 300pm to up to 400pm; that's scientifically dishonest. You need to have a true 0. Doing so, the increase all of a sudden looks less dramatic... is that maybe the reason why it's often plotted dishonestly?
pps: I still have difficulties in understanding how a trace gas that comprises 0.04% of the atmosphere (compared to N2: 78% and O2 19%) can have such a large impact, especially since the change in atmospheric composition is a little over 0.01% over the last 100 yrs. Maybe there are some good posts on this? - Could global warming be caused by natural cycles?
cruzn246 at 04:44 AM on 12 January, 2011
"ENSO (El Nino Southern Oscillation) and PDO (Pacific Decadal Oscillation) help to explain short-term variations, but have no long-term trend, warming or otherwise. Additionally, these cycles simply move thermal energy between the ocean and the atmosphere, and do not change the energy balance of the Earth."
Of course they don't do it by themselves. Think of the effect they cause though. When the PDO goes negative for a time more ice and snow build over the N hemisphere. What happens then? More energy is reflected away; Less water vapor is in the air. (That forgotten greenhouse gas that we still can't properly quantify worldwide, either presently or historically)
I still think we are in a warming cycle. Sure Milanovich is important, but there is a heck of a lot of variability in when the ice ages trip into motion within that cycle. When it does it is sudden. In fact Milanovich may just be coincidental rather than causative when it comes to Ice Ages. No one has ever come out and proven Milanovich causes the Ice Age cycle.
I think it is all about when sea levels rise high enough to really upset the important ocean circulations that allow us to stay warm. Until then, we will probably have basically neutral periods followed by warming periods, unless some big old volcano blows up. Then we could get some major cooling.
JMO, but there are good reasons to think this way. - We're heading into cooling
muoncounter at 04:58 AM on 8 January, 2011
#15: "it lined up with the NAO/PDO cycles"
Every time we go off topic on one of these NAO/PDO tangents, I have to wonder how an oscillation can give rise to a long period increasing trend. But that topic belongs to this thread. - It's cooling
JMurphy at 11:53 AM on 26 November, 2010
daybyday wrote : "Geologist Dr. Don Easterbrook's projected cooling for the next several decades and is based on past PDO patterns for the past century and temperature patterns for the past 500 years."
What expertise do you believe that this geologist has that makes him relevant to your opinion ? I believe he stated it would be cooling by now - compare that with the NASA data above, and you might be interested in this review of his work.
daybyday wrote : "Until Greenland has the green meadows and longer growing season it enjoyed in the 1400's I won't buy into the "warming" craze--and if it happens I will be happy for the planet because those warmer periods bring a cornucopia of plenty to the earth and its people (polar bears survived that period just fine). and if the glaciers return with a vengeance, I will be happy becasue it will make it harder for man to survive and that is how we advance--by overcoming adversity."
Do you have any evidence for those "green meadows" and that "longer growing season" ? You should read further on this website, particularly :
Positives and negatives of global warming
Greenland used to be green
PDO
daybyday wrote : "But like I said, I can't understand the secret numbers behind the numbers, and charts behind the charts and I am certainly way too simple to understand the cycles of nature and cooling and warming. I just read history and take the numbers at face value--how dumb is that?"
There are no secrets but you do need to know how to look at the data, how to use it and how not to use it. It is also best if you avoid some of the more dodgy AGW denial sites out there, and check anything that you use in your posts, to make sure that you are posting information that can be backed-up or confirmed, especially by yourself. - It's Pacific Decadal Oscillation
Daniel Bailey at 15:32 PM on 25 November, 2010
It might be instructive to read Atmoz' take on PDO: On the Relationship between the Pacific Decadal Oscillation (PDO) and the Global Average Mean Temperature.
[Edit:
After much searching, I finally was able to resurrect a cached copy of this post on PDO by Tamino: Exclamation Points !!! as well as this one: PDO: the Pacific Decadal Oscillation.
End edit]
The Yooper - It's Pacific Decadal Oscillation
JMurphy at 12:47 PM on 25 November, 2010
WHATDOWEKNOW, are you looking at the Intermediate version of this thread ? Have you also read this thread ?
Do you see the figure which shows "the contrast in trends between PDO and global temperature. Obviously the PDO as an oscillation between positive and negative values shows no long term trend. In contrast, temperature displays a long term warming trend."
And, despite what you may believe, the warming is continuing. - Ice-Free Arctic
CBDunkerson at 08:02 AM on 8 November, 2010
Various points;
Riccardo #14, Arctic ice volume accuracy - While the PIOMAS model results are the only continuous 'record' I am aware of it should be noted that this has been validated against submarine and ICESat records. Thus, there is a fairly strong case for the PIOMAS results being accurate within a relatively small margin of error.
Camburn #17, "...we are at the end of the 30 year cycle" - What cycle are you referring to? The usual '30 year cycle' that skeptics go on about is the Pacific Decadal Oscillation... but we are actually ten years into the 'cool' phase of that rather than "at the end".
Oamoe #16, Cryosat - Cryosat has actually been "collecting data" since April. They have been fine tuning the sensors and working out the kinks, but the commissioning phase actually ended a couple of weeks ago. I'm not sure whether they will release anything from prior to the end of the commissioning phase since they were still making adjustments during that period, but they should be able to tell us whether the current (remarkably low) volume reported by PIOMAS is roughly accurate. - Water vapor is the most powerful greenhouse gas
archiesteel at 09:56 AM on 26 September, 2010
@cruzn246: wow, you're really goign through the gamut of debunked arguments, aren't you. What's next, it's because of Solar Irradiance?
The PDO is currently *negative*, why would it warm us? It's also a cyclical phenomenon that doesn't show a long-term trend, which we are experiencing.
"Good enough?"
Not by a long shot.
It's Pacific Decadal Oscillation
Instead of randomly posting graphs you clearly don't understand, I suggest you actually start learning some science. Again, it's clear you have no idea what you're talking about, and are simply trolling on this site. - Billions of Blow Dryers: Some Missing Heat Returns to Haunt Us
citizenschallenge at 16:36 PM on 23 September, 2010
Yes, excellent, informative post. First class.
I'm back to wondering about how the Pacific Decadal Oscillation might interact with deep sea thermohaline circulation... mixing dynamics?
Any info? - Should The Earth Be Cooling?
Daniel Bailey at 00:01 AM on 20 September, 2010
Re: Ken Lambert (56)"Ned's Chart at post #18 here:
Are we even looking at the same graphic? The overall trend (1900-2010, 1980-2010) is UP. Perhaps your razor-focus on statistically insignificant timescales blinds you to that fact. Most people would care to be ACCURATE in their statements and assertions and would note that fact. You are WRONG.
http://www.skepticalscience.com/The-Pacific-Decadal-Oscillation-and-global-warming.html
shows smoothed GISS land + SST and RSS temperatures which sure looks like flattening over the last 8-10 years. That's if a clear reduction in the slope of a curve is flattening - which for most people it is.""SLR flattening by nearly all analyses"
Um, no. Wrong again. Here's what it actually looks like over that interval (from Tamino, reproduced from the University of Colorado site).
You mistake natural variations of noisy signals over statistically insignificant timeframes for "flattening" (is that the new meme de jour?). You are CHERRY PICKING. You also make unfounded assertions with NO analysis of your own to support your baseless claims."And all this at a time when the last decade of theoretical CO2GHG forcing 'has been the highest decade' since the last ice age. Sound familiar?"
There's nothing "theoretical" about the greenhouse gas effects of CO2. It's all reproducible in the lab, and has been since the 1800's. Did you not take science classes in school? You are correct in that CO2 concentrations have been at their highest levels in millennia; the "aughts" are hotter than the 90's, which were hotter than the 80's which were hotter than the 70's, and this year is the hottest year ever (thus far). Note the trend here.
You waste all of our time, and that of the readers here as well.
Gimme something of substance, some meat and potatoes, to work with here. I'd LOVE for you to be right, but so far you're just statistically significantly "flattening" your credibility. Sound familiar?
The Yooper - Should The Earth Be Cooling?
Ken Lambert at 22:35 PM on 19 September, 2010
Daniel Bailey (The Yooper?) and kdkd
I will repeat this for you both gentlemen:
Ned's Chart at post #18 here:
http://www.skepticalscience.com/The-Pacific-Decadal-Oscillation-and-global-warming.html
shows smoothed GISS land + SST and RSS temperatures which sure looks like flattening over the last 8-10 years. That's if a clear reduction in the slope of a curve is flattening - which for most people it is.
Some facts please kdkd - your derogatory comment can be vented elsewhere - we are trying to keep ad hominem attack out of this blog.
Just to repeat some 'multiple independent lines of evidence' - temperature flattening, SLR flattening by nearly all analyses, and OHC flattening or nil by the imperfect but best we have Argo; and Dr Trenberth can only find 60% of the 'missing heat' which has probably gone missing forever. (It has not only left the building - but probably left the planet!)
And all this at a time when the last decade of theoretical CO2GHG forcing 'has been the highest decade' since the last ice age. Sound familiar? - Should The Earth Be Cooling?
Ken Lambert at 23:29 PM on 18 September, 2010
JMurphy #46
Ned's Chart at post #18 here:
http://www.skepticalscience.com/The-Pacific-Decadal-Oscillation-and-global-warming.html
shows smoothed GISS land + SST and RSS temperatures which sure looks like flattening over the last 8-10 years. That's if a clear reduction in the slope of a curve is flattening - which for most people it is.
Not desperate - just fact JM. - The Pacific Decadal Oscillation and global warming
Arkadiusz Semczyszak at 21:51 PM on 16 September, 2010
The PDO is closely linked of SOI and ENSO.
The relationship between Pacific Decadal and Southern Oscillations: Implications for the climate of northwestern Baja California., Pavia, 2009.:
“These results confirm that El Niño-Southern Oscillation (ENSO) forces the PDO.”
Professor Horst Malberg, analyzed ENSO and SOI in paper: La Niña - El Niño und der solare Einfluss, (Editor: Institut für Meteorologie - Berlin, 2009 - work is only available in German), write:
“Any temperature variation demonstrates the weakness of the working hypothesis of a dominant influence of anthropogenic CO2 effect on climate change. For the voiced suspicion that the anthropogenic greenhouse effect would be, if not before 1950, significantly influence at least after 1950, climate change, there is no real climatological evidence. Everything indicates that it is also in the last six decades by the IPCC in the postulated dominant CO2 greenhouse effect on global temperature change (warming) just a sham causality.” - The Pacific Decadal Oscillation and global warming
CoalGeologist at 15:30 PM on 16 September, 2010
This is a bit confusing for non-experts (such as me). Having also read the comments from "It's Pacific Decadal Oscillation" and the limited number of other sources I could access, Bern has got it right, but there's something more to the story!.
Confusion arises because of the difference between: 1) "Pacific Decadal Oscillation" (PDO), which is a generic term describing any multi-decadal cyclicity in temperature anywhere in the Pacific Ocean, and 2) "PDO Index", ("PDOI") which indicates the regionally averaged temperature of the Northern Pacific Ocean. The PDOI provides an indicator of the timing and cyclicity of the PDO.
Within the Pacific, however, are smaller-scale temperature zones that show temperature cycles occurring on the same cyclicity as the PDO, but having opposite trends!!!
PDO Index is defined as:
"[...] the leading PC [principal component] of monthly SST anomalies in the North Pacific Ocean, poleward of 20N. The monthly mean global average SST anomalies are removed to separate this pattern of variability from any "global warming" signal that may be present in the data."
(emphasis added).
(Source: http://jisao.washington.edu/pdo/PDO.latest)
Thus, the PDO Index indicates the average temperature of the entire northern Pacific Ocean, normalized for the global increase in temperature. This trend (squiggly blue line) shows two broad cycles:
1) 1890-1924: Mostly Cool Period
2) 1925-1946: Mostly Warm Period
3) 1947-1976: Mostly Cool Period
4) 1976- ~mid-1990s: Mostly Warm Period
It is important to note that these trends describe the average temperature across the entire northern Pacific. When the data are gridded into individual cells, then contoured, this produces the colored patterns shown in the map above. Two "snapshots" are depicted... one representing a "Warm" phase, the other reprenting a "Cool" phase. (It's hard to say exactly what time period each snapshot represents.) In any case, this is where it gets a bit more confusing. In the "Warm" phase, the predominant trend is that of cool water across most of the northern Pacific. And the "Cool" phase is dominated by an extensive tract of warm water in the northern Pacific.
To understand the origin of the terms, you need to look at the water along the coasts of Alaska, extending downward into the Pacific Northwest (of the USA). You'll see that the water there is the opposite color of the predominant trend. Keep in mind that the point of the paper by Hare (1996) was to interpret the impact of the PDO on salmon fishery, so they were mostly considering the temperatures of the near-shore waters.
The important aspect of the maps, noted by John Cook, is that the water sloshes this way and that. Areas that are warm in one cycle tend to be cool in the next, and vice versa. There's no net impact on global warming. Or is there?!
The cool PDOI interval (My #3) corresponds to the broad decline in the rate of global warming seen in the red "Global Temperature Anomaly" trend, and the warm PDOI (My #4) coincides with the more rapid increase in the Global Temperature Anomaly... so while I don't believe that the PDO can account for the overall warming trend in the Global Anomaly, it's not inappropriate for skeptics to point out the correlation!
More than 100 comments found. Only the most recent 100 have been displayed.
More than 100 comments found. Only the most recent 100 have been displayed.


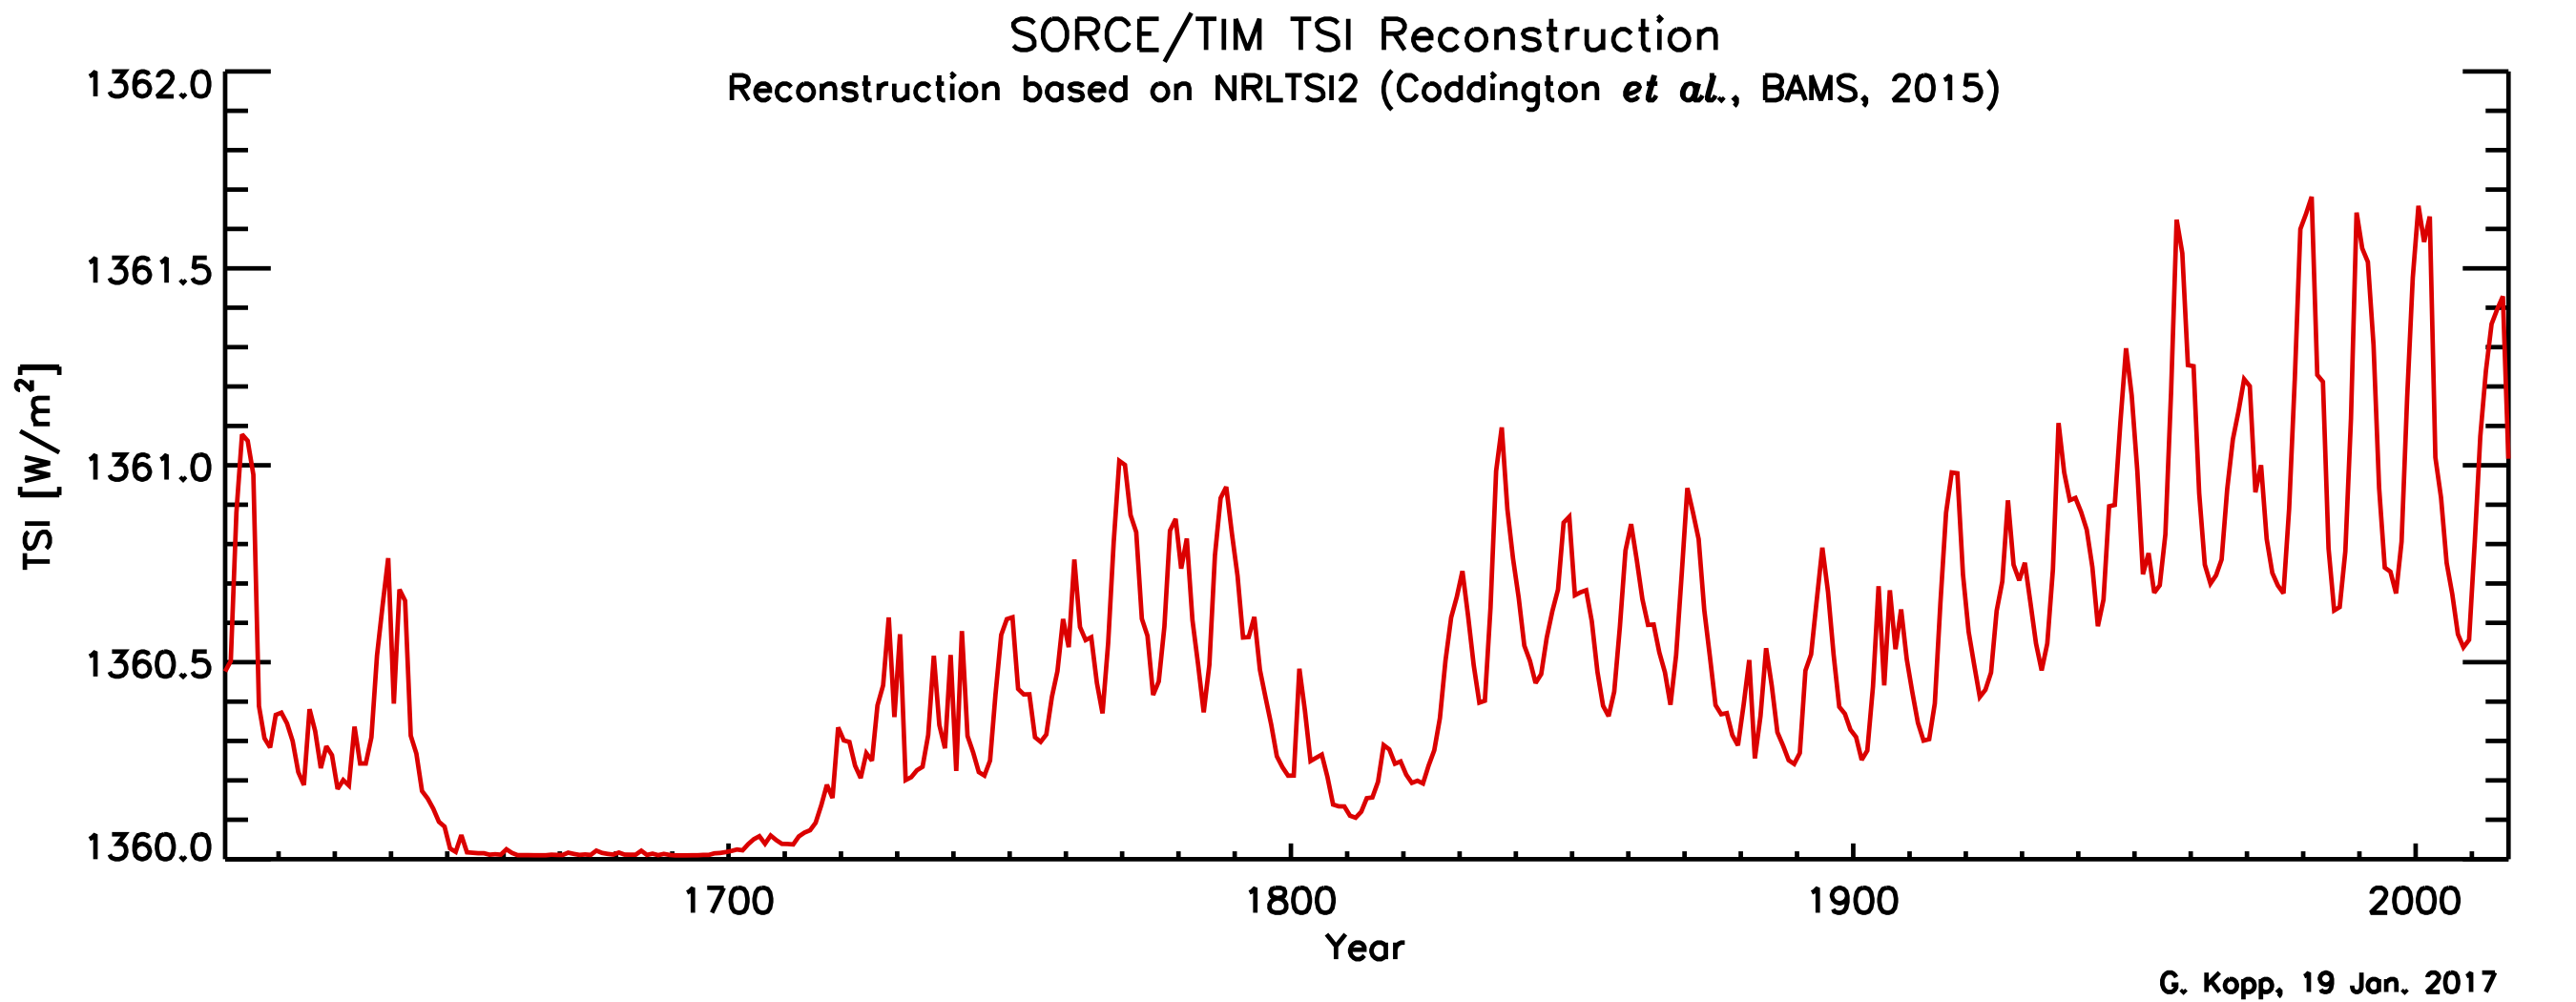
THE ESCALATOR

(free to republish)