


 Arguments


Are surface temperature records reliable?
What the science says...
| Select a level... |
 Basic
Basic
|
 Intermediate
|
 Advanced
| ||||
|
Numerous studies into the effect of urban heat island effect and microsite influences find they have negligible effect on long-term trends, particularly when averaged over large regions. |
|||||||
Temp record is unreliable
"We found [U.S. weather] stations located next to the exhaust fans of air conditioning units, surrounded by asphalt parking lots and roads, on blistering-hot rooftops, and near sidewalks and buildings that absorb and radiate heat. We found 68 stations located at wastewater treatment plants, where the process of waste digestion causes temperatures to be higher than in surrounding areas.
In fact, we found that 89 percent of the stations – nearly 9 of every 10 – fail to meet the National Weather Service’s own siting requirements that stations must be 30 meters (about 100 feet) or more away from an artificial heating or radiating/reflecting heat source." (Watts 2009)
The goal of improving temperature data is something we can all agree on and on this point, the efforts of Anthony Watts and Steve McIntyre are laudable. However, their presupposition that improving temperature records will remove or significantly lower the global warming trend is erroneous.
Adjusting for urban heat island effect
When compiling temperature records, NASA's GISS goes to great pains to remove any possible influence from urban heat island effect. They compare urban long-term trends to nearby rural trends. They then adjust the urban trend so it matches the rural trend. The process is described in detail on the NASA website (Hansen 2001).
They found in most cases, urban warming was small and fell within uncertainty ranges. Surprisingly, 42% of city trends are cooler relative to their country surroundings as weather stations are often sited in cool islands (a park within the city). The point is they're aware of UHI and rigorously adjust for it when analyzing temperature records. More on urban heat island...
Climate Audit and NASA's "Y2K" glitch
Steve McIntyre's discovery of a glitch in the GISS temperature data is an impressive achievement. Make no mistake, it's an embarrassing error on the part of NASA. But what is the significance?
Figure 1 compares the global temperature trend from before and after adjustments. Before the error was discovered, the trend was 0.185°C/decade. After corrections were made, the trend was still 0.185°C/decade. The change to the global mean was less than one thousandth of a degree. More on NASA's Y2K glitch...

Figure 1: Global temperature anomaly before (red squares) and after (black diamonds) NASA's "Y2K" corrections (Open Mind).
Other lines of evidence for rising temperatures
The surface temperature trends are also confirmed from multiple, independent sources:
- Surface temperature analysis by NASA GISS finds strong agreement with two independent analyses by CRU's Global Temperature Record and NCDC.
- Weather balloon measurements have found from 1975 through 2005, the global mean, near-surface air temperature warmed by approximately 0.23°C/decade.
- Satellite measurements of lower atmosphere temperatures show temperature rises between 0.16°C and 0.24°C/decade since 1982.
- Ice core reconstructions found the 20th century to be the warmest of the past five centuries, confirming the results of earlier proxy reconstructions.
- Sea surface temperatures, borehole reconstructions and ocean temperatures all show long-term warming trends.
Reanalysis data sets also show the same warming trend. A ‘reanalysis’ is a climate or weather model simulation of the past that incorporates data from historical observations. Reanalysis comparisons by Vose et al. (2012) and Compo et al. (2013) find nearly identical global surface warming trends as in the instrumental record (Figure 2).
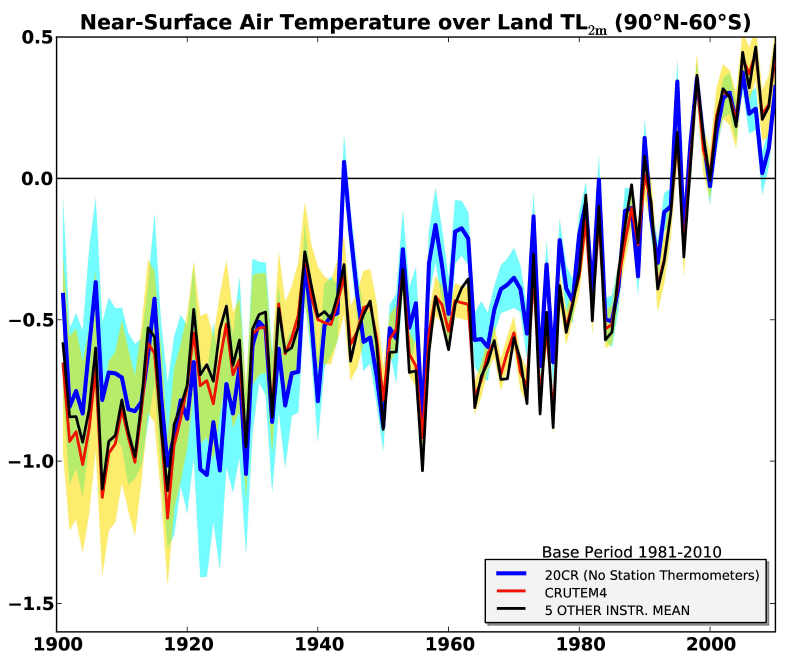
Figure 2: Temporal comparison of near-global land (90°N–60°S) 2 meter air temperature anomalies (TL2m) between 20CR and station-temperature based estimates. Red curve: global TL2m anomaly series from CRUTEM4, black curve: the average of five additional station-temperature datasets, and blue curve: the 20CR. 95% uncertainty ranges are shown for CRUTEM4 (yellow fill) and 20CR (blue fill) and their overlap (green fill). From Compo et al. (2013)
A paper by Anderson et al. (2012) also created a new global surface temperature record reconstruction using 173 records with some type of physical or biological link to global surface temperatures (corals, ice cores, speleothems, lake and ocean sediments, and historical documents). The study compared their reconstruction to the instrumental temperature record and found a strong correlation between the two (0.76; Figure 3).
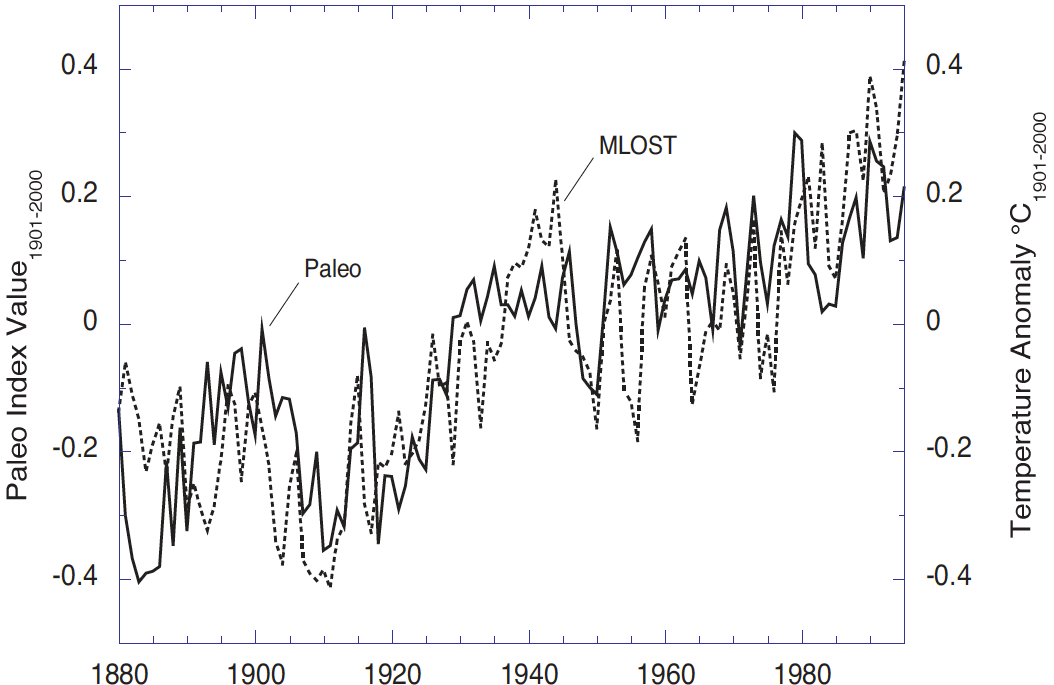
Figure 3: Natural temperature proxy reconstruction (solid) and the merged land-ocean surface temperature anomalies (MLOST, dashed) relative to 1901-2000. The range of the paleo trends index values is coincidentally nearly the same as the GST although the quantities are different (index values versus temperature anomalies °C).
Intermediate rebuttal written by dana1981
Last updated on 9 November 2017 by pattimer. View Archives


Climate Myth...